Erasing the stain: Challenging the stigma of opioid substitution treatment. Findings from a stakeholder workshop

Author: Vicky Carlisle. Twitter: @Vic_Carlisle, Email: vicky.carlisle@bristol.ac.uk

On Wednesday 7th July 2021, I brought together key stakeholders with an interest in improving opioid substitution treatment (OST) from across the UK. This included people with lived experience, Public Health England staff, local authority public health practitioners, treatment service leads, pharmacists and academics. We discussed the findings of my recently completed PhD, and together we considered the next stages of developing an intervention to improve OST.

A summary of my research

For those not familiar with the topic, OST refers to the treatment of opioid dependency with either methadone or buprenorphine (alongside psychosocial support). Through my research, I wanted to understand what the key facilitators and barriers are to people ‘recovering’ in OST. To do this, I drew on both quantitative and qualitative methodologies. I found that loneliness, isolation and experiences of trauma and stigma were key barriers to recovery; whereas positive social support, discovering a sense of purpose and continuity of care were valuable facilitators.

Importantly, some factors appear to act as both facilitators and barriers to recovery in OST. For instance, I found that some service users used isolation as a form of self-protection (to shield themselves from negative influences), however this often left them feeling lonely and disconnected from the potential benefits offered by developing more positive social support networks.

Undoubtedly, the strongest barrier to recovery was stigma. Service users told me that they experience stigma from a range of sources, including from family and friends, healthcare professionals and members of the wider community. I found similar patterns in the literature review that I carried out (Carlisle et al, 2020). Stigma is like a stain where an individuals’ entire identity is defined by a single, negative attribute. In the case of OST, individuals may possess overlapping stigmatised identities of ‘OST service user’, ‘drug user’ and ‘injecting drug user’. Some will be further stigmatised due to experiencing homelessness, being HIV or Hepatitis C positive or through involvement in sex-work.

“I found that loneliness, isolation and experiences of trauma and stigma were key barriers to recovery”

Community pharmacies are one environment where service users report experiencing a great deal of stigma. Unlike customers collecting other prescriptions, many OST service users receive their medications (methadone/buprenorphine) through an arrangement known as ‘supervised consumption’. This means they must be observed taking their medication by a pharmacist to ensure that it is not diverted to others. This is often conducted in full view of other customers, despite guidelines which recommend that this takes place in a private room or screened area. This leaves OST service users open to the scrutiny of the ‘public gaze’.

My findings have several implications in relation to stigma. Firstly, OST service users receive poorer care than other members of society in healthcare settings, which may result in them avoiding seeking help from drug treatment and for other health conditions. Secondly, stigmatising OST service users makes community re-integration extremely challenging and this has been directly linked to individuals returning to drug using networks as it is somewhere they feel a sense of belonging. The ultimate impact of being repeatedly exposed to stigma is an internalisation of these judgements, resulting in feelings of shame and worthlessness – again impacting on individuals’ ability to seek help and develop supportive new relationships with others.

Figure 1: Key facilitators and barriers to recovery, retention and completion in OST at each level of the socioecological model. Stigma is present at every level of the system.

What we discussed during the workshop

Being able to present these findings to key stakeholders was a real highlight of my PhD work; it’s not often that you have the ear of so many invested and engaged individuals in one ‘room’ (albeit a Zoom room!). The findings of my PhD chimed closely with the experiences of those in the room and would be further reflected the next day when Dame Carol Black’s Review of Drugs Part 2 was published, which made specific reference to stigma.

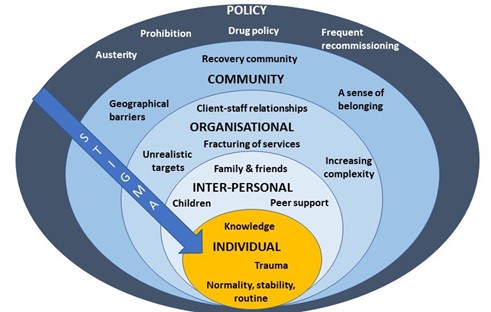
After I presented a short overview of my PhD findings, attendees spent time in small groups discussing how we might address OST stigma at each level of the socioecological system (see figure 1, above). A common thread that ran through each of the groups’ discussions was the importance of embedding interventions within trauma-informed frameworks. Attendees felt that increasing others’ understanding of the impact of trauma and ‘adverse childhood experiences’ (ACEs) may be a key mechanism by which to reduce stigma towards OST service users.

Indeed, a recent study found promising results in relation to this – that increasing the public’s awareness of the role of ACEs in substance use reduced stigmatising attitudes towards people who use drugs (Sumnall et al, 2021). Workshop attendees suggested that this outcome could be achieved through trauma-informed training of all individuals who might work with OST service users, such as pharmacists, the police and medical professionals, as well as those who work in healthcare settings, such as receptionists.

At the individual level there was a discussion about the way that stigma trickles down the socioecological system, resulting in self-stigma or internalised stigma. People felt that the best way to reduce this was to tackle stigma higher upstream first.

When thinking about reducing stigma in everyday inter-personal interactions, people highlighted the importance of using non-stigmatising language. For those who are interested (and I think we all should be!) the Scottish Drug Forum has published an excellent guide here.

Some excellent suggestions were made for reducing stigma that individuals experience in organisations such as pharmacies, hospitals and other settings. This is something that Dr Jenny Scott and I discussed in a recent article for the Pharmaceutical Journal (Scott & Carlisle, 2021). One attendee suggested the introduction of positive role-models within organisations who could be an exemplar of positive behaviour for others (a ‘stigma champion’ perhaps?). Training was identified as a key mechanism through which stigma could be reduced in organisations, including through exposure to people who use drugs (PWUD) and OST service users during training programmes. It was stressed however, that this should be carefully managed to ensure that a range of voices are presented and not just ones supporting dominant discourses around abstinence-based recovery.

Suggestions for improving community integration included increasing access to volunteering opportunities – something that people felt has been impacted by reduced funding to recovery services in recent years. It was also suggested that community and faith leaders could be a potential target for education around reducing stigma and understanding the impact of trauma, as these individuals may be best placed to have conversations about stigma with members of their communities.

Finally, there were some thoughtful discussions around the best way to influence policy to reduce stigma. The importance of showing policymakers the evidence-base from previous successful strategies was highlighted. Something that resulted in a lively debate was the issue of supervised consumption with arguments both for and against (this is also relevant at the organisational level). The group summarised that whilst diversion of medications was a risk for some, a blanket approach to supervised consumption and/or daily collections exposes individuals to stigma in the pharmacy, which leaves individuals vulnerable to dropping out of treatment. It was pointed out that supervised consumption policies were quickly relaxed at the start of Covid-19 restrictions – something that appears to have been done safely and with benefits to service users. It was also highlighted that supervised consumption in OST is inherently stigmatising, as users of other addictive drugs with overdose potential, such as other prescribed opioids and benzodiazepines, are not subjected to the same regulations. This sends a clear message to OST service users that they cannot be trusted. Other key suggestions were:

  • Communicating with CQCs and Royal Colleges, who may be particularly interested in understanding how people are treated in their services.
  • Drawing on existing stigma policies from other arenas e.g. mental health.
  • Highlighting the fiscal benefits of reducing stigma to key decision makers.
  • Tapping into plans for the new Police and Crime Commissioners, who have a trauma sub-group.
  • Linking into work with ADDER areas, which may provide the evidence for ‘what works’.

What next?

I am now planning to apply for further funding to develop an intervention to reduce organisational stigma towards OST service users. The involvement of service users and other key stakeholders will be crucial in every step of that process, so I will be putting together a steering group as well as seeking out collaborations with academics internationally that have expertise and an interest in this area. I was really pleased to see that Dame Carol Black’s second report makes some concrete recommendations around reducing stigma towards people who use drugs. I hope therefore to be able to work with the current momentum to make OST safer and more attractive to those whose lives depend on it.

I’d like to extend my gratitude to all of the attendees at the workshop and to Bristol’s Drug and Alcohol Health Integration Team (HIT) for supporting this event. If you are an individual with lived experience of OST, an academic, or any other stakeholder working in this area and would like to be involved with future developments, please get in touch with me at vicky.carlisle@bristol.ac.uk or find me on Twitter at @Vic_Carlisle.

References

Carlisle, V., Maynard, O., Padmanathan, P., Hickman, M., Thomas, K. H., & Kesten, J. (2020, September 7). Factors influencing recovery in opioid substitution treatment: a systematic review and thematic synthesis. https://doi.org/10.31234/osf.io/f6c3p

Scott, J & Carlisle, V (2021). A pharmacy resolution for 2021: let’s improve the way patients with addiction are treated. The Pharmaceutical Journal. https://pharmaceutical-journal.com/article/opinion/a-pharmacy-resolution-for-2021-lets-improve-the-way-patients-with-addiction-are-treated

Sumnall, H. R., Hamilton, I., Atkinson, A. M., Montgomery, C., & Gage, S. H. (2021). Representation of adverse childhood experiences is associated with lower public stigma towards people who use drugs: an exploratory experimental study. Drugs: Education, Prevention and Policy, 28(3), 227-239. https://doi.org/10.1080/09687637.2020.1820450

This blog was originally posted on the TARG blog on the 1 October 2021.

COVID-19: Pandemics and ‘Infodemics’

JGI Seed Corn funded project 

Drs Luisa Zuccolo and Cheryl McQuire, Department of Population Health Sciences, Bristol Medical School, University of Bristol. 

The problem 

Soon after the World Health Organisation (WHO) declared COVID-19 a pandemic on March 11th 2020, the UN declared the start of an infodemic, highlighting the danger posed by the fast spreading of unchecked misinformation. Defined as an overabundance of information, including deliberate efforts to disseminate incorrect information, the COVID-19 infodemic has exacerbated public mistrust and jeopardised public health.  

Social media platforms remain a leading contributor to the rapid spread of COVID-19 misinformation. Despite urgent calls from the WHO to combat this, public health responses have been severely limited. In this project, we took steps to begin to understand and address this problem.  

We believe that it is imperative that public health researchers evolve and develop the skills and collaborations necessary to combat misinformation in the social media landscape. For this reason, in Autumn 2020 we extended our interest in public health messaging, usually around promoting healthy behaviours during pregnancy, to study COVID-19 misinformation on social media. 

We wanted to know:  

What is the nature, extent and reach of misinformation about face masks on Twitter during the COVID-19 pandemic? 

To answer this question we aimed to: 

  1. Upskill public health researchers in the data capture and analysis methods required for social media data research; 
  2. Work collaboratively with Research IT and Research Software Engineer colleagues to conduct a pilot study harnessing social media data to explore misinformation. 

The team 

Dr Cheryl McQuire got the project funded and off the ground. Dr Luisa Zuccolo led it through to completion. Dr Maria Sobczyk checked the data and analysed our preliminary dataResearch IT colleagues, led by Mr Mike Joneshelped to develop the search strategy and built a data pipeline to retrieve and store Twitter data using customised application programming interfaces (APIs) accessed through an academic Twitter accountResearch Software Engineering colleagues, led by Dr Christopher Woods, provided consultancy services and advised on the analysis plan and technical execution of the project. 

Cheryl McQuire, Luisa Zuccolo, Maria Sobcyzk, Mike Jones, Christopher Woods. (Left to Right)

Too much information?!

Initial testing of the Twitter API showed that keywords, such as ‘mask’ and ‘masks’, returned an unmanageable amount of data, and our queries would often crash due to an overload of Twitter servers (503-type errors). To address this, we sought to reduce the number of results, while maintaining a broad coverage of the first year of the pandemic (March 2020-April 2021).

Specifically, we:

I) Searched for hashtags rather than keywords, restricting to English language.

II) Requested original tweets only, omitting replies and retweets.

III)  Broke each month down into its individual days in our search queries to minimise the risk of overload.

IV) Developed Python scripts to query the Twitter API and process the results into a series of CSV files containing anonymised tweets, metadata and metrics about the tweets (no. of likes, retweets etc.), and details and metrics about the author (no. of followers etc.).

V) Merged data into a single CSV file with all the tweets for each calendar month after removing duplicates.

What did we find?

Our search strategy delivered over three million tweets. Just under half of these were filtered out by removing commercial URLs and undesired keywords, the remaining 1.7m tweets by ~700k users were analysed using standard and customized R scripts.

First, we used unsupervised methods to describe any and all Twitter activity picked up by our broad searches (whether classified as misinformation or not). The timeline of this activity revealed clear peaks around the UK-enforced mask mandates in June and September 2020.

We further described the entire corpus of tweets on face masks by mapping the network of its most common bigrams and performing sentiment analysis.


We then quantified the nature and extent of misinformation through topic modelling, and used simple counts of likes to estimate the reach of misinformation. We used semi-supervised methods including manual keyword searches to look for established types of misinformation such as face masks restricting oxygen supply. These revealed that the risk of bacterial/fungal infection was the most common type of misinformation, followed by restriction of oxygen supply, although the extent of misinformation on the risks of infection decreased as the pandemic unfolded.

Extent of misinformation (no tweets), according to its nature: 1- gas exchange/oxygen deprivation, 2- risk of bacterial/fungal infection, 3- ineffectiveness in reducing transmission, 4- poor learning outcomes in schools.


Relative to the volume of tweets including the hashtags relevant to face masks (~1.7m), our searches uncovered less than 3.5% unique tweets containing one of the four types of misinformation against mask usage.

A summary of the nature, extent and reach of misinformation on face masks on Twitter – results from manual keywords search (semi-supervised topic modelling).

A more in-depth analysis of the results attributed to the 4 main misinformation topics by the semi-supervised method revealed a number of potentially spurious topics. Refinements of these methods including iterative fine-tuning were beyond the scope of this pilot analysis.


Our initial exploration of Twitter data for public health messaging also revealed common pitfalls of mining Twitter data, including the need for a selective search strategy when using academic Twitter accounts, hashtag ‘hijacking’ meaning most tweets were irrelevant, imperfect Twitter language filters and ads often exploiting user mentions.

Next steps

We hope to secure further funding to follow-up this pilot project. By expanding our collaboration network, we aim to improve the way we tackle misinformation in the public health domain, ultimately increasing the impact of this work. If you’re interested in health messaging, misinformation and social media, we would love to hear from you – @Luisa_Zu and @cheryl_mcquire.

Note:

This blog post was original written for the Jean Golding Institute blog

Study collecting the views of young people, parents of children with long COVID, and doctors, finds that long COVID in children is poorly understood by doctors

Dr Katharine Looker

‘Enhancing the utilization of COVID-19 testing in schools’, is a study which will look at the characteristics of long COVID and COVID-19 infection in children. ‘Long COVID’ is commonly used to describe signs and symptoms that continue or develop after acute COVID‑19. The study is being funded as a result of a rapid funding call by Health Data Research UK (HDR UK), the Office for National Statistics (ONS) and UK Research and Innovation (UKRI). The study forms part of the larger Data and Connectivity National Core Study, which is led by HDR UK in partnership with ONS.

The COVID-19 testing in schools study is related to the CoMMinS (COVID-19 Mapping and Mitigation in Schools) study being undertaken by the University of Bristol in partnership with Bristol City Council, Public Health England [PHE] and Bristol schools. CoMMinS aims to give us an understanding of COVID-19 infection dynamics centred around school pupils and staff and onward transmission to family contacts, using regular testing. Our study will jointly analyse data from CoMMinS, along with information from Electronic Patient Records, and data from the COVID-19 Schools Infection Survey (SIS; jointly led by the London School of Hygiene & Tropical Medicine [LSHTM], PHE, and ONS). The SIS is a study similar to CoMMinS but carried out nationally.

To help inform research questions and methods for the study, members from the University of Bristol study team gathered views about long COVID in children between 9 March and 30 April 2021 from:

  • seven young people from the NIHR Bristol Biomedical Research Centre Young People’s Advisory Group (YPAG)
  • five families whose children have long COVID or suspected long COVID, recruited through two online UK campaign groups for long COVID, and
  • a survey completed by four GPs and one paediatrician, and an online meeting with two paediatricians.

It is important to note that the opinions gathered were based on small samples which may not be representative.

Through the meeting and survey with the doctors, the study team found that clinical understanding of long COVID in children is currently very limited.

The doctors said that it may be hard to distinguish between long COVID and other conditions with similar symptoms. Many of the symptoms of long COVID, like fatigue and feeling sick, aren’t very specific, and are common to many different conditions. Long COVID in children currently lacks a clinical definition, making diagnosis difficult. It isn’t yet properly understood whether long COVID is a new condition in itself, or a group of conditions like post viral fatigue, which is already recognised.

Young people, and families of children with long COVID or suspected long COVID, who were also asked for their opinion, said that feeling sick or stomach pain, extreme tiredness, and headaches were the symptoms they would rank as most ‘harmful’. For young people, this was based on them imagining having the symptoms. For the families, this was based on their first-hand experience.

The families also said that the symptoms their children were experiencing were numerous, often very severe, and more wide-ranging than those currently listed on the NHS website for long COVID. It is not yet clear what is causing the unusual symptoms.

The families said that they had struggled to get a diagnosis and treatment for their children. They also said that long COVID symptoms were having a significant impact on their children’s day-to-day lives both physically and psychologically, and that some of the children had missed school because of the symptoms. Some of the families also found fevers difficult to manage because their children had to miss school to self-isolate every time they had a fever. They wanted to know why the set of symptoms were being experienced, and why their children in particular had developed them.

It is not known how many children have or will develop long COVID. So far, studies which have tried to measure the rate of long COVID in children suggest it is rare. However, quantifying the number of cases is made difficult by a lack of clinical understanding of long COVID including the lack of an agreed clinical definition. The opinions collected suggest that relying on clinical diagnoses alone will under-estimate cases. On the other hand, there needs to be a cautious approach to estimating the number of cases based on non-specific symptoms, as other conditions which cause similar symptoms may be counted as well.

Caroline Relton, Professor of Epigenetic Epidemiology and Director of the Bristol Population Health Science Institute at the University of Bristol, joint lead for CoMMinS and one of the lead authors of the report, said: “The opinions we gathered further highlight that it is difficult to count the number of children with long COVID on the basis of diagnoses alone while long COVID in children remains poorly defined.

“There are added complications of studying long COVID in children, when it is sometimes difficult to disentangle what might be the result of experiencing infection from what might result from the wider impact of experiencing the pandemic. Isolation, school closures, disrupted education and other influences on family life could all have health consequences. Defining the extent of the problem in children and the root causes will be essential to helping provide the right treatment and to aid the recovery of young people who are suffering.”

The findings highlight that examining GP and hospital visits, and school attendance, might currently be a more useful and feasible way of assessing how COVID-19 has affected children, rather than relying only on diagnoses of long COVID. However, the study researchers also need to be aware how often healthcare is accessed according to need, and absence from school due to self-isolation, which will affect what is being measured.

Feeling sick or stomach pain, extreme tiredness, and headaches will be important symptoms to consider in the study.

Read the full report

Find the full report on the CoMMinS study news page.


Using genetics to understand the relationship between young people’s health and educational outcomes

Amanda Hughes, Kaitlin H. Wade, Matt Dickson, Frances Rice, Alisha Davies, Neil M. Davies & Laura D. Howe

Follow Amanda, Kaitlin, Matt, Alisha, Neil and Laura on twitter

Young people with health problems tend to do less well in school than other students, but it has never been clear why. One explanation is that health problems directly damage educational outcomes. In that case, policymakers aiming to raise educational standards might want to focus first on health as a means of improving attainment.

But are there other explanations? What if falling behind in school can affect health, for instance causing depression? Also, many health problems are more common among children from less advantaged backgrounds – for example, from families with fewer financial resources, or whose parents are themselves unwell. These children also tend to do less well in school, for reasons that may have nothing to do with their own health. How do we know if their health, or their circumstances, are affecting attainment?

It is also unclear if health matters equally for education at all points in development, or particularly in certain school years. Establishing how much health does impact learning, when, and through which mechanisms, would better equip policymakers to improve educational outcomes.

Photo by Edvin Johansson on Unsplash

Using genetic data helps us understand causality

Genetic data can help us answer these questions. Crucially, experiences like family financial difficulties, which might influence both a young person’s health and their learning, cannot change their genes. So, if young people genetically inclined to have asthma are more absent from school, or do less well in their GCSEs, that would strongly suggest an impact of asthma itself. Similarly, while falling behind in school might well trigger depression, it cannot change a person’s genetic propensity for depression. So, a connection between genetic propensity for depression and worse educational outcomes supports an impact of depression itself. This approach, of harnessing genetic information to better understand causal processes, is known as Mendelian randomization.

To find out more, we investigated links between

  • health conditions in childhood and adolescence
  • school absence in years 10 & 11
  • and GCSE results.

We used data from 6113 children born in the Bristol area in 1991-1992. All were participants of the Avon Longitudinal Study of Parents and Children (ALSPAC), also known as Children of the 90s. We focused on six different aspects of health: asthma, migraines, body mass index (BMI), and symptoms of depression, of attention-deficit hyperactivity disorder (ADHD), and of autism spectrum disorder (ASD). These conditions, though diverse, have two important things in common: they affect substantial numbers of young people, and they are at least in part influenced by genetics.

Alongside questionnaire data and education records, we also analysed genetic information from participants’ blood samples. From this information, we were able to calculate for each young person a summary score of genetic propensity for experiencing migraines, ADHD, depression, ASD, and for having a higher BMI.

We used these scores to predict the health conditions, rather than relying just on reports from questionnaire data. In this way, we avoided bias due to the impact of the young people’s circumstances, or of their education on their health rather than vice versa.

Even a small increase in school absence predicted worse GCSEs.

We found that, for each extra day per year of school missed in year 10 or 11, a child’s total GCSE points from their best 8 subjects was a bit less than half (0.43) of a grade lower. Higher BMI was related to increased school absence & lower GCSE grades.

Using the genetic approach, we found that young people genetically predisposed towards a higher BMI were more often absent from school, and they did less well in their GCSEs. A standard-deviation increase* in BMI corresponded to 9% more school absence, and GCSEs around 1/3 grade lower in every subject. Together, these results indicate that increased school absence may be one mechanism by which being heavier could negatively impact learning. However, in other analyses, we found a substantial part of the BMI-GCSEs link was not explained by school absence. It’s unclear which other mechanisms are at play here, but work by other researchers has suggested that weight-related bullying, and negative effects of being heavier on young people’s self-esteem, could interfere with learning.

*equivalent to the difference between the median (50th percentile) in population and the 84th percentile of the population

Diagram showing the pathways through which higher BMI could lead to lower GCSEs; either through more schools absence aged 14-16, or other processes such as weight-related bullying.
Our results suggest increased school absence may partly explain impact of higher BMI on educational attainment, but that other processes are also involved.

ADHD was related to lower GCSE grades, but not increased school absence.

In line with previous research, young people genetically predisposed to ADHD did less well in their GCSEs.  Interestingly, they did not have increased school absence, suggesting that ADHD’s impact on learning works mostly through other pathways. This is consistent with previous research highlighting the importance of other factors on the academic attainment of children with ADHD, including expectations of the school environment, teacher views and attitudes, and bullying by peers.

We found little evidence for an impact of asthma, migraines, depression or ASD on school absence or GCSE results

Our genetic analyses found little support for a negative impact of asthma, migraines, depression or ASD on educational attainment. However, we know relatively little about the genetic influences on depression and ASD, especially compared to the genetics of BMI, which we understand much better. This makes genetic associations with depression or ASD difficult to detect. So, our results should not be taken as conclusive evidence that these conditions do not affect learning.

What does this mean for students and teachers?

Our findings provide evidence of a detrimental impact of high BMI and of ADHD symptoms on GCSE attainment, which for BMI was partially mediated by school absence. When students sent home during the pandemic eventually return to school, the impact on their learning will have been enormous.  And while all students will have been affected, our results highlight that young people who are heavier, who have ADHD, or are experiencing other health problems, will likely need extra support.

Further reading

Hughes, A., Wade, K.H., Dickson, M. et al. Common health conditions in childhood and adolescence, school absence, and educational attainment: Mendelian randomization study. npj Sci. Learn. 6, 1 (2021). https://doi.org/10.1038/s41539-020-00080-6

A version of this blog was posted on the journal’s blog site on 21 Jan 2021.

Contact the researchers

Amanda Hughes, Senior Research Associate in Epidemiology: amanda.hughes@bristol.ac.uk

COVID19 – should schools close early for Christmas?

Sarah Lewis, Marcus Munafo and George Davey Smith


We have previously written about the limited risk posed to pupils, teachers and the community by schools being open during the Covid19 pandemic. Schools have now been open for almost a full academic term (3 months), so it is time to take another look at the evidence.

School re-openings have coincided with an increase in Covid19 infection rates across all UK nations. This rise in infection rates was anticipated, given the annual pattern of rising respiratory infections in the autumn term. There was also a rapid increase in Covid19 testing rates as children returned to school and presented with mild symptoms. Rates of positivity among children were very low at first, but a rise was observed over the autumn. This corresponded with an increase in rates among adults, and there seems to be a strong correlation between Covid19 positivity in schools and rates in the local community.

But has transmission of Covid19 in schools driven the second wave? And should schools be closed again to reduce infection in the community?

This post argues that there is little case for closing schools, as

  • Schools don’t seem to drive transmission in the community
  • The risk of the virus to most school children is very low
  • The harms of school closures are wide ranging.
Photo by CDC on Unsplash

Infection rates among children have been low

Since September children with COVID19 symptoms have been asked to stay at home and have a test before returning to school. Tests equating to 10% of the school pupil population were carried out during first half term in Scotland; only 0.2% of pupils tested positive during this period. Similarly high volumes of testing have been carried out in Wales, but only 0.6% of pupils tested positive between 1st September and 9th December 2020. Pupils made up 3.5% of cases in Wales over that period, despite making up 16% of the population.

However, the weekly Covid19 incidence among 12-16 year olds in Wales was similar to the national average for the week ending 9th December 2020, suggesting a change in the age demographic of cases.

Transmission levels in school have been low

It is unclear what proportion of children who tested positive contracted the infection in school – many children have similar social circles both in and out of school. When infections are found in schools, most schools have only 1 or 2 cases within a 2-week period (unless levels in the local community are high). This suggests low levels of transmission in schools.

Children and adults have different symptoms

Comparisons of rates of infection between children and adults should be treated with caution. Cases are diagnosed using recognised Covid19 symptoms, and are influenced by the volume of testing in the community. Younger children seem to be less likely to have symptoms – around 50% of infected children tend to be completely asymptomatic.  They also may have somewhat different pattern of symptoms to adults – fatigue, gastrointestinal symptoms, and changes in sense of smell or taste, but only rarely a cough. Therefore, studies relying on symptoms in children may be unreliable.

Random testing is the best way to find out level of infection

Surveys show that while young adults had the highest levels of infection in September, secondary school pupils now have the highest rates.

Studies which test individuals at random in the community are more reliable indicators of the levels of infection among children compared to adults. The UK Office of National Statistics (ONS) infection survey has been randomly testing people from the community since early May. It showed that young adults (school year 11 to age 24) had the highest positivity rates in September. This became more pronounced in early October when universities re-opened to students. By the end of October, rates among secondary school pupils were similar to those in young adults, at around 2%. Secondary school pupils now have the highest rates. Covid19 positive rates among primary school children are about half those in secondary school children and have barely changed since the beginning of the academic year.

Infection rates among teachers

There is no evidence that teachers are more at risk of death from COVID19, and infection rates among teachers do not seem higher than other professions.

ONS data from the first wave of the COVID19 epidemic in the UK showed that teachers were not at increased risk of death from the disease compared to other professionals. Based on ONS data, during October those working in the education sector had an antibody positivity rate of 8.1% (95% CI 5.9-10.8) compared with 6.5% (95% CI 5.9-7.3) among those working in other professions. This suggests perhaps slightly higher infection rates, but this is estimated with uncertainty.

Infection positivity rates – also measured by the ONS survey –  from 2nd September to 16th October showed that teachers were no more likely to test positive than other professions, although again there was a lot of uncertainty in these estimates*.  The Swedish Public Health Agency have linked data on Covid19 infection to occupational data and found no increase in infection rates among teachers, although there was some evidence of an increase in infection rates among teaching assistants, school counsellor and  headteachers. However, infection rates may have been inflated relative to other profession if there is  increased testing among asymptomatic people in the education sector.

Photo by Jeswin Thomas on Unsplash

Could infections in schools be driving community infection rates?

The evidence suggests this is unlikely.

Infection rate increases appear to coincide with school openings, but the R-number was increasing in Scotland and England before school openings. Hospital admissions due to Covid19 had also started to rise before this point. In September, positivity rates were initially highest among young adults, not among children of school age, suggesting that perhaps infections among school children were not driving community rates. The ONS data showed infection rates levelling off over October half term, and climbing again among young adults and secondary school children after half term. However, this trend was not as marked in primary school children, and was not observed in adults, even amongst the 35-49 year age group, to which many parents of school aged children belong. Another study of community-based testing – the REACT-1 study – found a greater decrease in infections among younger children compared with older children following the October half term holiday, but again there was a lot of uncertainty in this estimate.

Contact mixing patterns show that people tend to have the most contacts within the same age group, followed by the age group closest to them. Children have more opportunities to pass on the infection to other children and young adults, and are not significantly influencing rates in older adults.

The current R-number in England is currently estimated to be slightly below 1 despite schools being open. This shows that it is possible to drive down infection rates in the community whilst keeping schools open. Furthermore, when everything else but schools are closed – such as in the case of the national lockdown which occurred in England in November, school children will have more contacts than anyone else and schools will contribute to relatively more transmissions in the community even if transmission rates are low overall.

Closing schools is not the answer

Rates have recently fallen among adults in England, despite schools remaining open and secondary school rates increasing. The evidence suggests low levels of virus transmission within schools. First Minister of Wales Mark Drakeford recently said that behavioural evidence suggests closing schools could place some children “in even riskier environments”. Children being looked after by their grandparents rather than being in school would be more dangerous in terms of the virus being transmitted to a higher risk group.

Any public health intervention should consider the costs as well as the benefits. We know that school closures have wide ranging adverse consequences for children and families as outlined by UNESCO, and such costs are particularly pronounced for the poorest and most vulnerable children in society. Children:

  • who do not have access to technology to participate in online learning
  • whose parents who do not have the resources or the educational background to help

have been shown to fall further behind following school closures. Evidence suggests that children’s mental health deteriorated during the first lockdown, and that vulnerable children were at greater risk of violence and exploitation. School closures can also cause economic hardship due to parents being unable to work.  This has prompted Robert Jenkins Global Chief of Education at UNICEF to issue a statement over the last few days saying:

“Evidence shows that schools are not the main drivers of this pandemic. Yet, we are seeing an alarming trend whereby governments are once again closing down schools as a first recourse rather than a last resort. In some cases, this is being done nationwide, rather than community by community, and children are continuing to suffer the devastating impacts on their learning, mental and physical well-being and safety”.

If schools being open are not major drivers of transmission in the community (which they don’t appear to be), given that the risk of the virus to most school children is very low, there is very little case for closing them given the potential harm this could cause.

Footnote: Secondary schools in Wales were closed early for Christmas on the 11th December 2020

*(estimates ranged from 0.2% (95%CI=0.07-0.53) for primary school teachers to 0.5% teachers of unknown type (95% CI=0.36-0.69) compared with 0.4% (95%=0.39-0.49) for all other professions)

Epigenetics regulate our genes: but how do they change as we grow up?

Rosa Mulder1,2                    Esther Walton3,4 & Charlotte Cecil1,5,6

Follow Esther and Charlotte on Twitter.

Epigenetics can help explain how our genes and environment interact to shape our development. Interest in epigenetics has grown increasingly within the research community, but until now little was known about how epigenetics change over time. We therefore studied changes in our epigenome from birth to late adolescence and created an interactive website inviting other researchers to explore our findings.

What is epigenetics?

The term ‘epigenetics’ refers to the molecular structures around the DNA in our cells, that affect if, when, and how our genes work. Even though nearly every cell in our body contains the exact same copy of DNA, cells can look and function entirely differently. Epigenetics can explain this. For example, every cell in our body has the potential to store fat, but in adipose tissues the cells’ epigenetic structures cause the cells to actually store fat.

Before birth, epigenetics plays a role in the specialization of cells from conception onwards by turning genes ‘on’ and ‘off’. After birth, epigenetics help our body develop even further, and maintain the specialization of our cells. However, the way epigenetics influence how our cells function is not only programmed by our genes, but may also be affected by the environment. Hence, our development and health is shaped by both our genes and our environment. Researchers are therefore trying to measure epigenetic processes to understand the role that epigenetics plays in this process of ‘nurture affecting nature’.

Both nurture and nature influence our health; understanding epigenetics helps us to find out how they might interact.

How can we measure epigenetics?

One of the types of molecular structures that can affect gene functioning is ‘DNA methylation’. Here, a small molecule (a methyl group of one carbon atom bonded to three hydrogen atoms; Figure 1) is attached to the DNA sequence. DNA methylation affects the three-dimensional structure of the DNA and can thereby turn it ‘on’ or ‘off’. DNA methylation can now easily be measured in the lab with the help of micro-chips; very small chips that can detect hundreds of thousands of methylation sites in the genome at a time, from just a small droplet of blood. Such chips are now used in large epidemiological cohorts such as ALSPAC to measure the level of DNA methylation for each of these sites. In epigenome-wide associations studies (EWASs), researchers study the associations between each of these methylation sites and a trait, such as prenatal smoking, BMI, or stress.

Figure 1: DNA sequence with DNA methylation

How does DNA methylation change throughout development?

Until recently, EWASs have mainly been cross-sectional, studying DNA methylation only at one time-point. So, even though research indicates that epigenetics is important in postnatal development, we do not know how true this is for DNA methylation sites measured with these epigenome-wide arrays. Studying a mechanism that supposedly changes over time without  knowing how it changes can be problematic: say that we find an association between smoking during pregnancy and DNA methylation at birth, can we still expect this association to be there at a later age? To fully interpret EWAS findings, and to compare research findings between different studies, we need a full understanding of how DNA methylation changes throughout development.

We therefore set out to study DNA methylation from birth to late adolescence, using DNA methylation measured in blood from the participants of ALSPAC in the UK, as well as from participants from another large cohort, the Generation R Study in the Netherlands.

We studied the change in levels of DNA methylation over time as well as variation in this change between individuals. If DNA methylation is indeed mainly linked to the basic developmental stages we go through as we grow up, we would expect methylation changes to be largely consistent between individuals. However, if DNA methylation is affected more by the different environments we live in, and individual health profiles, we would expect a proportion of sites to change differently for different individuals.

Between ALSPAC and Generation R, we created a unique dataset containing over 5,000 samples from about 2,500 participants with DNA methylation measurements at almost half a million methylation sites measured repeatedly at birth, 6 years, 10 years, and at 17 years. With various statistical models we studied different trajectories of change in DNA methylation.

We found change in DNA methylation at just over half of the sites (see for an example Figure 2a). At about a quarter of sites, DNA methylation changed at a different rate for different individuals (Figure 2b). We further saw that sometimes change only happened in a specific time period; for example, only in between birth and the age of 6 years after which DNA methylation remained stable (Figure 2c), and that sometimes differences in the rate of change only started from the age of 9 years (Figure 2d). Last, for less than 1% of the sites on the chromosomes tested (we did exclude the sex chromosomes), we saw that DNA methylation changed differently for boys and girls (Figure 2e).

Figure 2. Different examples of methylation sites, with every graph representing one methylation site with age on the x-axis and level of DNA methylation on the y-axis. Every line represents change in DNA methylation over time for one individual, showing (a) change in DNA methylation, (b) different rates of change for different individuals, (c) change during the first six years of life, (d) different rates of change starting from 9 years of age, (e) different change for boys and girls, and (f) change, but no differences in rate of change in a site associated to prenatal smoking.

How can we use these findings in future research?

These results show that there are sites in the genome for that show change in DNA methylation that is consistent between individuals, as well as sites that change at a different rate for different individuals. We have published the trajectories of change for each methylation site on a publicly available website. This makes it easier for other researchers to find sites that are developmentally important and may be of relevance for health and disease. For example, a methylation site previously associated with prenatal smoking, remained stable over time (Figure 1f), indicating that prenatal influences of smoking may be long-lasting, at least up to adolescence. In the future, we hope to associate traits, such as stress and BMI, to these longitudinal changes, to further our understanding of the developmental nature of DNA methylation and the associated biological pathways leading to health and disease.


1Department of Child and Adolescent Psychiatry/Psychology, Erasmus MC, University Medical Center Rotterdam, Rotterdam, the Netherlands

2 Department of Child and Adolescent Psychiatry/Psychology, Erasmus MC, University Medical Center Rotterdam, Rotterdam, the Netherlands

3 MRC Integrative Epidemiology Unit, Population Health Sciences, Bristol Medical School, University of Bristol, Bristol, UK

4 Department of Psychology, University of Bath, Bath, UK

5 Department of Epidemiology, Erasmus MC, University Medical Center Rotterdam, Rotterdam, the Netherlands

6 Department of Psychology, Institute of Psychology, Psychiatry & Neuroscience, King’s College London, London, UK


Further reading

Mulder, R. H., Neumann, A. H., Cecil, C. A., Walton, E., Houtepen, L. C., Simpkin, A. J., … & Jaddoe, V. W. (2020). Epigenome-wide change and variation in DNA methylation from birth to late adolescence. bioRxiv. (preprint)

Epidelta project website: http://epidelta.mrcieu.ac.uk/

Are schools in the COVID-19 era safe?

Sarah Lewis, Marcus Munafo and George Davey Smith

Follow Sarah, George and Marcus on Twitter

The COVID-19 pandemic caused by the SARS-COV2 virus in 2020 has so far resulted in a heavy death toll and caused unprecedented disruption worldwide. Many countries have opted for drastic measures and even full lockdowns of all but essential services to slow the spread of disease and to stop health care systems becoming overwhelmed. However, whilst lockdowns happened fast and were well adhered to in most countries, coming out of lockdown is proving to be more challenging. Policymakers have been trying to balance relaxing restriction measures with keeping virus transmission low. One of the most controversial aspects has been when and how to reopen schools.

Many parents and teachers are asking: Are schools safe?

The answer to this question depends on how much risk an individual is prepared to accept – schools have never been completely “safe”. Also, in the context of this particular pandemic, the risk from COVID-19 to an individual varies substantially by age, sex and underlying health status. However, from a historical context, the risk of death from contracting an infectious disease in UK schools (even in the era of COVD-19) is very low compared to just 40 years ago, when measles, mumps, rubella and whooping cough were endemic in schools. Similarly, from a global perspective UK schools are very safe – in Malawi, for example, the mortality rate for teachers is around five times higher than in the UK, with tuberculosis causing more than 25% of deaths among teachers.

In this blog post we use data on death rates to discuss safety, because there is currently better evidence on death rates by occupational status than, for example, infection rates. This is because death rates related to COVID-19 have been consistently reported by teh Office for National Statistics, whereas data on infection rates depends very much on the level of testing in the community (which has changed over time and differs by region).

Risks to children

Thankfully the risk of serious disease and death to children throughout the pandemic, across the UK and globally, has been low. Children (under 18 years) make up around 20% of the UK population, but account for only around 1.5% of those hospitalised with COVID-19. This age group have had better outcomes according to all measures compared to adults. As of the 12th June 2020, there have been 6 deaths in those with COVID-19 among those aged under 15 years across England and Wales. Whilst extremely sad, these deaths represent a risk of around 1 death per 2 million children. To place this in some kind of context, the number of deaths expected due to lower respiratory tract infections among this age group in England and Wales over a 3 month period is around 50 and 12 children would normally die due to road traffic accidents in Great Britain over a 3-month period.

Risks to teachers

Our previous blog post concluded that based on available evidence the risk to teachers and childcare workers within the UK from Covid-19 did not appear to be any greater than for any other group of working age individuals. It considered mortality from COVID-19 among teachers and other educational professionals who were exposed to the virus prior to the lockdown period (23rd March 2020) and had died by the 20th April 2020 in the UK. This represents the period when infection rates were highest, and when children were attending school in large numbers. There were 2,494 deaths among working-age individuals up to this date, and we found that the 47 deaths among teachers over this period represented a similar risk to all professional occupations – 6.7 (95% CI 4.1 to 10.3) per 100,000 among males and 3.3 (95% CI 2.0 to 4.9) per 100,000 among females.

The Office for National Statistics (ONS) has since updated the information on deaths according to occupation to include all deaths up to the 25th May 2020. The new dataset includes a further 2,267 deaths among individuals with COVID-19. As the number of deaths had almost doubled during this extended period, so too had the risk. A further 43 deaths had occurred among teaching and education professionals, bringing the total number of deaths involving COVID-19 among this occupational group to 90. It therefore appears that lockdown (during which time many teachers have not been in school) has not had an impact on the rate at which teachers have been dying from COVID-19.

As before, COVID-19 risk does not appear greater for teachers than other working age individuals

The revised risk to teachers of dying from COVID-19 remains very similar to the overall risk for all professionals at 12.9 (95% CI 9.3 to 17.4) per 100,000 among all male teaching and educational professionals and 6.0 (95% CI 4.2 to 8.1) per 100,000 among all females, compared with 11.6 (95%CI 10.2 to 13.0) per 100,000 and 8.0 (95%CI 6.8 to 9.3) per 100,000 among all male and female professionals respectively. It is useful to look at the rate at which we would normally expect teaching and educational professionals to die during this period, as this tells us by how much COVID-19 has increased mortality in this group. The ONS provide this in the form of average mortality rates for each occupational group for same 11 week period over the last 5 years.  The mortality due to COVID-19 during this period represents 33% for males and 19% for females of their average mortality over the last 5 years for the same period. For male teaching and educational professionals, the proportion of average mortality due to COVID-19 is very close to the value for all working-aged males (31%) and all male professionals (34%). For females the proportion of average mortality due to COVID-19 is lower than for all working-aged females (25%) and for female professionals (25%). During the pandemic period covered by the ONS, there was little evidence that deaths from all causes among the group of teaching and educational professionals were elevated above the 5-year average for this group.

Teaching is a comparatively safe profession

It is important to note that according to ONS data on adults of working age (20-59 years) between 2001-2011, teachers and other educational professionals have low overall mortality rates compared with other occupations (ranking 3rd  safest occupation for women and 6th for men). The same study found a 3-fold difference between annual mortality among teachers and among the occupational groups with the highest mortality rates (plant and machine operatives for women and elementary construction occupations among men). These disparities in mortality from all causes also exist in the ONS data covering the COVID-19 pandemic period, but were even more pronounced with a 7-fold difference between males teaching and educational professionals and male elementary construction occupations, and a 16-fold difference between female teachers and female plant and machine operatives.

There is therefore currently no indication that teachers have an elevated risk of dying from COVID-19 relative to other occupations, and despite some teachers having died with COVID19, the mortality rate from all causes (including COVID19) for this occupational group over this pandemic period is not substantially higher than the 5 year average.

Will reopening schools increase risks to teachers?

One could argue that the risk to children and teachers has been low because schools were closed for much of the pandemic, and children have largely been confined to mixing with their own households, so that when schools open fully risk will increase. However, infection rates in the community are now much lower than they were at their peak, when schools were fully open to all pupils without social distancing. Studies which have used contract tracing to determine whether infected children have transmitted the disease to others have consistently shown that they have not, although the number of cases included has been small, and asymptomatic children are often not tested. Modelling studies estimate that even if schools fully reopen without social distancing, this is likely to have only modest effects on virus transmission in the community. If infection levels can be controlled – for example by testing and contact tracing efforts – and cases can be quickly isolated, then we believe that schools pose a minimal risk in terms of the transmission of COVID, and to the health of teachers and children. Furthermore, the risk is likely to be more than offset by the harms caused by ongoing disruption to children’s educational opportunities.

Sarah Lewis is a Senior Lecturer in Genetic Epidemiology in the department of Population Health Sciences, and is an affiliated member of the MRC Integrative Epidemiology Unit (IEU), University of Bristol.

Marcus Munafo is a Professor of Biological Psychology, in the School of Psychology Science and leads the Causes, Consequences and Modification of Health Behaviours programme of research in the IEU, University of Bristol.

George Davey Smith is a Professor of Clinical Epidemiology, and director of the MRC IEU, University of Bristol.

We should be cautious about associations of patient characteristics with COVID-19 outcomes that are identified in hospitalised patients.

Gareth J Griffith, Gibran Hemani, Annie Herbert, Giulia Mancano, Tim Morris, Lindsey Pike, Gemma C Sharp, Matt Tudball, Kate Tilling and Jonathan A C Sterne, together with the authors of a preprint on collider bias in COVID-19 studies.

All authors are members of the MRC Integrative Epidemiology Unit at the University of Bristol. Jonathan Sterne is Director of Health Data Research UK South West

Among successful actors, being physically attractive is inversely related to being a good actor. Among American college students, being academically gifted is inversely related to being good at sport.

Among people who have had a heart attack, smokers have better subsequent health than non-smokers. And among low birthweight infants, those whose mothers smoked during pregnancy are less likely to die than those whose mothers did not smoke.

These relationships are not likely to reflect cause and effect in the general population: smoking during pregnancy does not improve the health of low birthweight infants. Instead, they arise from a phenomenon called ‘selection bias’, or ‘collider bias’.

Understanding selection bias

Selection bias occurs when two characteristics influence whether a person is included in a group for which we analyse data. Suppose that two characteristics (for example, physical attractiveness and acting talent) are unrelated in the population but that each causes selection into the group (for example, people who have a successful Hollywood acting career). Among individuals with a successful acting career we will usually find that physical attractiveness will be negatively associated with acting talent: individuals who are more physically attractive will be less talented actors (Figure 1). Selection bias arises if we try to infer a cause-effect relationship between these two characteristics in the selected group. The term ‘collider bias’ refers to the two arrows indicating cause and effect that ‘collide’ at the effect (being a successful actor).

Figure 1: Selection effects exerted on successful Hollywood actors. Green boxes highlight characteristics that influence selection. Yellow boxes indicate the variable selected upon. Arrows indicate causal relationships: the dotted line indicates a non-causal induced relationship that arises because of selection bias.

Figure 2 below explains this phenomenon. Each point represents a hypothetical person, with their level of physical attractiveness plotted against their level of acting talent. In the general population (all data points) an individual’s attractiveness tells us nothing about their acting ability – the two characteristics are unrelated. The red data points represent successful Hollywood actors, who tend to be more physically attractive and to be more talented actors. The blue data points represent other people in the population. Among successful actors the two characteristics are strongly negatively associated (green line), solely because of the selection process. The direction of the bias (whether it is towards a positive or negative association) depends on the direction of the selection processes. If they act in the same direction (both positive or both negative) the bias will usually be towards a negative association. If they act in opposite directions the bias will usually be towards a positive association.

Figure 2:  The effect of sample selection on the relationship between attractiveness and acting talent. The green line depicts the negative association seen in successful actors.


Why is selection bias important for COVID-19 research?

In health research, selection processes may be less well understood, and we are often unable to observe the unselected group. For example, many studies of COVID-19 have been restricted to hospitalised patients, because it was not possible to identify all symptomatic patients, and testing was not widely available in the early phase of the pandemic. Selection bias can seriously distort relationships of risk factors for hospitalisation with COVID-19 outcomes such as requiring invasive ventilation, or mortality.

Figure 3 shows how selection bias can distort risk factor associations in hospitalised patients. We want to know the causal effect of smoking on risk of death due to COVID-19, and the data available to us is on patients hospitalised with COVID-19. Associations between all pairs of factors that influence hospitalisation will be distorted in hospitalised patients. For example, if smoking and frailty each make an individual more likely to be hospitalised with COVID-19 (either because they influence infection with SARS-CoV-2 or because they influence COVID-19 disease severity), then their association in hospitalised patients will usually be more negative than in the whole population. Unless we control for all causes of hospitalisation, our estimate of the effect of any individual risk factor on COVID-19 mortality will be biased. For example, it would be unsurprising that within hospitalised patients with COVID-19 we observe that smokers have better health than non-smokers because they are likely to be younger and less frail, and therefore less likely to die after hospitalisation. But that finding may not reflect a protective effect of smoking on COVID-19 mortality in the whole population.

Figure 3: Selection effects on hospitalisation with COVID-19. Box colours are as in Figure 1. Blue boxes represent outcomes. Arrows indicate causal relationships, the dotted line indicates a non-causal induced relationship that arises because of selection bias.


Selection bias may also be a problem in studies based on data from participants who volunteer to download and use COVID-19 symptom reporting apps. People with COVID-19 symptoms are more likely to use the app, and so are people with other characteristics (younger people, people who own a smartphone, and those to whom the app is promoted on social media). Risk factor associations within app users may therefore not generalise to the wider population.

What can be done?

Findings from COVID-19 studies conducted in selected groups should be interpreted with great caution unless selection bias has been explicitly addressed. Two ways to do so are readily available. The preferred approach uses representative data collection for the whole population to weight the sample and adjust for the selection bias.  In absence of data on the whole population, researchers should conduct sensitivity analyses that adjust their findings based on a range of assumptions about the selection effects. A series of resources providing further reading, and tools allowing researchers to investigate plausible selection effects are provided below.

For further information please contact Gareth Griffith (g.griffith@bristol.ac.uk) or Jonathan Sterne (jonathan.sterne@bristol.ac.uk).

Further reading and selection tools:

Dahabreh IJ and Kent DM. Index Event Bias as an Explanation for the Paradoxes of Recurrence Risk Research. JAMA 2011; 305(8): 822-823.

Griffith, Gareth, Tim M. Morris, Matt Tudball, Annie Herbert, Giulia Mancano, Lindsey Pike, Gemma C. Sharp, Jonathan Sterne, Tom M. Palmer, George Davey Smith, Kate Tilling, Luisa Zuccolo, Neil M. Davies, and Gibran Hemani. Collider Bias undermines our understanding of COVID-19 disease risk and severity. Interactive App 2020 http://apps.mrcieu.ac.uk/ascrtain/

Groenwold, RH, Palmer TM and Tilling K. Conditioning on a mediator to adjust for unmeasured confounding OSF Preprint 2020: https://osf.io/vrcuf/

Hernán MA, Hernández-Díaz S and Robins JM. A structural approach to selection bias. Epidemiology 2004; 15: 615-625.

Munafo MR, Tilling K, Taylor AE, Evans DM and Davey Smith G. Collider Scope: When Selection Bias Can Substantially Influence Observed Associations. International Journal of Epidemiology 2018; 47: 226-35.

Luque-Fernandez MA, Schomaker M, Redondo-Sanchez D, Sanchez Perez MJ, Vaidya A and Schnitzer ME. Educational Note: Paradoxical collider effect in the analysis of non-communicable disease epidemiological data: a reproducible illustration and web application International Journal of Epidemiology 2019; 48: 640-653. Interactive App: https://watzilei.com/shiny/collider/

Smith LH and VanderWeele TJ. Bounding bias due to selection. Epidemiology 2019; 30: 509-516. Interactive App: https://selection-bias.herokuapp.com


Are teachers at high risk of death from Covid19?

Sarah Lewis, George Davey Smith and Marcus Munafo

Follow Sarah, George and Marcus on Twitter

Due to the SARS-CoV-2 pandemic schools across the United Kingdom were closed to all but a small minority of pupils (children of keyworkers and vulnerable children) on the 20th March 2020, with some schools reporting as few as 5 pupils currently attending. The UK government have now issued guidance that primary schools in England should start to accept pupils back from the 1st June 2020 with a staggered return, starting with reception, year 1 and year 6.

Concern from teachers’ unions

This has prompted understandable concern from the  teachers’ unions, and on the 13th May, nine unions which represent teachers and education professionals signed a joint statement calling on the government to postpone reopening school on the 1st June, “We all want schools to re-open, but that should only happen when it is safe to do so. The government is showing a lack of understanding about the dangers of the spread of coronavirus within schools, and outwards from schools to parents, sibling and relatives, and to the wider community.” At the same time, others have suggested that the harms to many children due to neglect, abuse and missed educational opportunity arising from school closures outweigh the small increased risk to children, teachers and other adults of catching the virus.

What risk does Covid19 pose to children?

Weighing up the risks to children and teachers

So what do we know about the risk to children and to teachers? We know that children are about half as likely to catch the virus from an infected person as adults, and  if they do catch the virus they  are likely to have only mild symptoms.  The current evidence, although inconclusive, also suggests that they may be less likely to transmit the virus than adults.  However, teachers have rightly pointed out that there is a risk of transmission between the teachers themselves and between parents and teachers.

The first death from COVID-19 in England was recorded at the beginning of March 2020 and by the 8th May 2020 39,071 deaths involving COVID-19 had been reported in England and Wales. Just three of these deaths were among children aged under 15 years and  only a small proportion of the deaths (4416 individuals, 11.3%) were among working aged people.  Even among this age group risk is not uniform; it increases sharply with age from 2.6 in 100,000 for 25-44 years olds with a ten fold increase to 26 in  100,000 individuals for those aged 45-64.

Risks to teachers compared to other occupations

In addition, each underlying health condition increases the risk of dying from COVID-19, with those having at least 1 underlying health problem making up most cases.   The Office for National Statistics in the UK have published age standardised deaths by occupation for all deaths involving COVID-19 up to the 20th April 2020. Most of the people dying by this date would have been infected at the peak of the pandemic in the UK  prior to the lockdown period. They found that during this period there were 2494 deaths involving Covid-19 in the working age population. The mortality rate for Covid-19 during this period was 9.9 (95% confidence intervals 9.4-10.4) per 100,000 males and 5.2 (95%CI 4.9-5.6) per 100,000 females, with Covid-19 involved in around 1 in 4 and 1 in 5 of all deaths among males and females respectively.

Amongst teaching and education professionals (which includes school teachers, university lecturers and other education professionals) a total of 47 deaths (involving Covid-19) were recorded, equating to mortality rates of 6.7 (95%CI 4.1-10.3) per 100,000 among males and 3.3 (95%CI 2.0-4.9) per 100,000 among females, which was very similar to the rates of 5.6 (95%CI 4.6-6.6) per 100,000 among males and 4.2(95%CI 3.3-5.2) per 100,000 females for all professionals. The mortality figures for all education professionals includes 7 out of 437000 (or 1.6 per 100,000 teachers) primary and nursery school teachers and 17 out of 395000 (or 4.3 per 100,000 teachers) secondary school teachers.  A further 20 deaths occurred amongst childcare workers giving a mortality rate amongst this group of 3.4 (95%CI=2.0-5.5) per 100,000 females (males were highly underrepresented in this group), this is in contrast to rates of 6.5 (95%CI=4.9-9.1) for female sales assistants and 12.7(95%CI= 9.8-16.2) for female care home workers.

Covid-19 risk does not appear greater for teachers than other working age individuals

In summary, based on current evidence the risk to teachers and childcare workers within the UK from Covid-19 does not appear to be any greater than for any other group of working age individuals. However, perceptions of elevated risk may have occurred, prompting some to ask “Why are so many teachers dying?” due to the way this issue is portrayed in the media with headlines such as “Revealed: At least 26 teachers have died from Covid-19” currently on the https://www.tes.com website. This kind of reporting, along with the inability of the government to communicate the substantial differences in risk between different population groups – in particular according to age – has caused understandable anxiety among teachers. Whilst, some teachers may not be prepared to accept any level of risk of becoming infected with the virus whilst at work, others may be reassured that the risk to them is small, particularly given that we all accept some level of risk in our lives, a value that can never be zero.

Likely impact on transmission in the community is unclear

As the majority of parents or guardians of school aged children will be in the 25-45 age range, the risk to them  is also likely to be small. Questions remain however around the effect of school openings on transmission in the community and the associated risk. This will be affected by many factors including the existing infection levels in the community, the extent to which pupils, parents and teachers are mixing outside of school (and at the school gate) and mixing between individuals of different age groups. This is the primary consideration of the government Scientific Advisory Group for Emergencies (SAGE) who are using modelling based on a series of assumptions to determine the effect of school openings on R0.


Sarah Lewis is a Senior Lecturer in Genetic Epidemiology in the department of Population Health Sciences, and is an affiliated member of the MRC Integrative Epidemiology Unit (IEU), University of Bristol

George Davey Smith is a Professor of Clinical Epidemiology, and director of the MRC IEU, University of Bristol

Marcus Munafo is a Professor of Biological Psychology, in the School of Psychology Science and leads the Causes, Consequences and Modification of Health Behaviours programme of research in the IEU, University of Bristol.


What can genetics tell us about how sleep affects our health?

Deborah Lawlor, Professor of Epidemiology, Emma Anderson, MRC Research Fellow, Marcus Munafò, Professor of Experimental Psychology, Mark Gibson, PhD student, Rebecca Richmond, Vice Chancellor’s Research Fellow

Follow Deborah, Marcus, and Rebecca on Twitter

Association is not causation – are we fooled (confounded) when we see associations between sleep problems and disease?

Sleep is important for health. Observational studies show that people who report having sleep problems are more likely to be overweight, and have more health problems including heart disease, some cancers and mental health problems.

A major problem with conventional observational studies is that we cannot tell whether these associations are causal; does being overweight cause sleep problems, or do sleep problems cause people to become overweight? Alternatively, factors that influence how we sleep may also influence our health. For example, smoking might cause sleep problems as well as heart disease and so we are fooled (confounded) into thinking sleep problems cause heart disease when it is really all explained by smoking. In the green paper Advancing our Health: Prevention in the 2020s, the UK Government acknowledged that sleep has had little attention in policy, and that causality between sleep and health is likely to run in both directions.

But, how can we determine the direction of causality for sure? And, how do we make sure we are results are not confounded?

Randomly allocated genetic variation

Our genes are randomly allocated to us from our parents when we are conceived. They do not change across our lifespan, and cannot be changed by smoking, overweight or ill health.

Here at the MRC Integrative Epidemiology Unit we have developed a research method called Mendelian randomization, which uses this family-level random allocation of genes to explore causal effects. To find out more about Mendelian randomization take a look at this primer from the Director of the Unit (Prof George Davey Smith).

In the last two years, we and colleagues from the Universities of Manchester, Exeter and Harvard have identified large numbers of genetic variants that relate to different sleep characteristics. These include:

  • Insomnia symptoms
  • How long, on average, someone sleeps each night
  • Chronotype (whether someone is an ‘early bird’ or ‘lark’ and prefers mornings, or a ‘night owl’ and prefers evenings). Chronotype is thought to reflect variation in our body clock (known as circadian rhythms).

We can use these genetic variants in Mendelian randomization studies to get a better understanding of whether sleep characteristics affect health and disease.

What we did

In our initial studies we used Mendelian randomization to explore the effects of sleep duration, insomnia and chronotype on body mass index, coronary heart disease, mental health problems, Alzheimer’s disease, and breast cancer. We analysed whether the genetic traits that are related to sleep characteristics – rather than the sleep characteristics themselves – are associated with the health outcomes. We combined those results with the effect of the genetic variants on sleep traits which allows us to estimate a causal effect. Using genetic variants rather than participants’ reports of their sleep characteristics makes us much more certain that the effects we identify are not due to confounding or reverse causation.

Are you a night owl or a lark?

What we found

Our results show a mixed picture; different sleep characteristics have varying effects on a range of health outcomes.

What does this mean?

Having better research evidence about the effects of sleep traits on different health outcomes means that we can give better advice to people at risk of specific health problems. For example, developing effective programmes to alleviate insomnia may prevent coronary heart disease and depression in those at risk. It can also help reduce worry about sleep and health, by demonstrating that some associations that have been found in previous studies are not likely to reflect causality.

If you are worried about your own sleep, the NHS has some useful guidance and signposting to further support.

Want to find out more?

Contact the researchers

Deborah A Lawlor mailto:d.a.lawlor@bristol.ac.uk

Further reading

This research has been published in the following open access research papers:

Genome-wide association analyses of chronotype in 697,828 individuals provides insights into circadian rhythms. Nature Comms (2019) https://www.nature.com/articles/s41467-018-08259-7

Biological and clinical insights from genetics of insomnia symptoms.  Nature Gen. (2019) https://www.ncbi.nlm.nih.gov/pmc/articles/PMC6415688/

Genome-wide association study identifies genetic loci for self-reported habitual sleep duration supported by accelerometer-derived estimates. Nature Comms. (2019) https://www.nature.com/articles/s41467-019-08917-4

Investigating causal relations between sleep traits and risk of breast cancer in women: mendelian randomisation study. BMJ (2019) https://www.bmj.com/content/365/bmj.l2327

Is disrupted sleep a risk factor for Alzheimer’s disease? Evidence from a two-sample Mendelian randomization analysis. https://www.biorxiv.org/content/10.1101/609834v1 (open access pre-print)

Evidence for Genetic Correlations and Bidirectional, Causal Effects Between Smoking and Sleep Behaviors. Nicotine and Tobacco (2018) https://www.ncbi.nlm.nih.gov/pmc/articles/PMC6528151/