Erasing the stain: Challenging the stigma of opioid substitution treatment. Findings from a stakeholder workshop

Author: Vicky Carlisle. Twitter: @Vic_Carlisle, Email: vicky.carlisle@bristol.ac.uk

On Wednesday 7th July 2021, I brought together key stakeholders with an interest in improving opioid substitution treatment (OST) from across the UK. This included people with lived experience, Public Health England staff, local authority public health practitioners, treatment service leads, pharmacists and academics. We discussed the findings of my recently completed PhD, and together we considered the next stages of developing an intervention to improve OST.

A summary of my research

For those not familiar with the topic, OST refers to the treatment of opioid dependency with either methadone or buprenorphine (alongside psychosocial support). Through my research, I wanted to understand what the key facilitators and barriers are to people ‘recovering’ in OST. To do this, I drew on both quantitative and qualitative methodologies. I found that loneliness, isolation and experiences of trauma and stigma were key barriers to recovery; whereas positive social support, discovering a sense of purpose and continuity of care were valuable facilitators.

Importantly, some factors appear to act as both facilitators and barriers to recovery in OST. For instance, I found that some service users used isolation as a form of self-protection (to shield themselves from negative influences), however this often left them feeling lonely and disconnected from the potential benefits offered by developing more positive social support networks.

Undoubtedly, the strongest barrier to recovery was stigma. Service users told me that they experience stigma from a range of sources, including from family and friends, healthcare professionals and members of the wider community. I found similar patterns in the literature review that I carried out (Carlisle et al, 2020). Stigma is like a stain where an individuals’ entire identity is defined by a single, negative attribute. In the case of OST, individuals may possess overlapping stigmatised identities of ‘OST service user’, ‘drug user’ and ‘injecting drug user’. Some will be further stigmatised due to experiencing homelessness, being HIV or Hepatitis C positive or through involvement in sex-work.

“I found that loneliness, isolation and experiences of trauma and stigma were key barriers to recovery”

Community pharmacies are one environment where service users report experiencing a great deal of stigma. Unlike customers collecting other prescriptions, many OST service users receive their medications (methadone/buprenorphine) through an arrangement known as ‘supervised consumption’. This means they must be observed taking their medication by a pharmacist to ensure that it is not diverted to others. This is often conducted in full view of other customers, despite guidelines which recommend that this takes place in a private room or screened area. This leaves OST service users open to the scrutiny of the ‘public gaze’.

My findings have several implications in relation to stigma. Firstly, OST service users receive poorer care than other members of society in healthcare settings, which may result in them avoiding seeking help from drug treatment and for other health conditions. Secondly, stigmatising OST service users makes community re-integration extremely challenging and this has been directly linked to individuals returning to drug using networks as it is somewhere they feel a sense of belonging. The ultimate impact of being repeatedly exposed to stigma is an internalisation of these judgements, resulting in feelings of shame and worthlessness – again impacting on individuals’ ability to seek help and develop supportive new relationships with others.

Figure 1: Key facilitators and barriers to recovery, retention and completion in OST at each level of the socioecological model. Stigma is present at every level of the system.

What we discussed during the workshop

Being able to present these findings to key stakeholders was a real highlight of my PhD work; it’s not often that you have the ear of so many invested and engaged individuals in one ‘room’ (albeit a Zoom room!). The findings of my PhD chimed closely with the experiences of those in the room and would be further reflected the next day when Dame Carol Black’s Review of Drugs Part 2 was published, which made specific reference to stigma.

After I presented a short overview of my PhD findings, attendees spent time in small groups discussing how we might address OST stigma at each level of the socioecological system (see figure 1, above). A common thread that ran through each of the groups’ discussions was the importance of embedding interventions within trauma-informed frameworks. Attendees felt that increasing others’ understanding of the impact of trauma and ‘adverse childhood experiences’ (ACEs) may be a key mechanism by which to reduce stigma towards OST service users.

Indeed, a recent study found promising results in relation to this – that increasing the public’s awareness of the role of ACEs in substance use reduced stigmatising attitudes towards people who use drugs (Sumnall et al, 2021). Workshop attendees suggested that this outcome could be achieved through trauma-informed training of all individuals who might work with OST service users, such as pharmacists, the police and medical professionals, as well as those who work in healthcare settings, such as receptionists.

At the individual level there was a discussion about the way that stigma trickles down the socioecological system, resulting in self-stigma or internalised stigma. People felt that the best way to reduce this was to tackle stigma higher upstream first.

When thinking about reducing stigma in everyday inter-personal interactions, people highlighted the importance of using non-stigmatising language. For those who are interested (and I think we all should be!) the Scottish Drug Forum has published an excellent guide here.

Some excellent suggestions were made for reducing stigma that individuals experience in organisations such as pharmacies, hospitals and other settings. This is something that Dr Jenny Scott and I discussed in a recent article for the Pharmaceutical Journal (Scott & Carlisle, 2021). One attendee suggested the introduction of positive role-models within organisations who could be an exemplar of positive behaviour for others (a ‘stigma champion’ perhaps?). Training was identified as a key mechanism through which stigma could be reduced in organisations, including through exposure to people who use drugs (PWUD) and OST service users during training programmes. It was stressed however, that this should be carefully managed to ensure that a range of voices are presented and not just ones supporting dominant discourses around abstinence-based recovery.

Suggestions for improving community integration included increasing access to volunteering opportunities – something that people felt has been impacted by reduced funding to recovery services in recent years. It was also suggested that community and faith leaders could be a potential target for education around reducing stigma and understanding the impact of trauma, as these individuals may be best placed to have conversations about stigma with members of their communities.

Finally, there were some thoughtful discussions around the best way to influence policy to reduce stigma. The importance of showing policymakers the evidence-base from previous successful strategies was highlighted. Something that resulted in a lively debate was the issue of supervised consumption with arguments both for and against (this is also relevant at the organisational level). The group summarised that whilst diversion of medications was a risk for some, a blanket approach to supervised consumption and/or daily collections exposes individuals to stigma in the pharmacy, which leaves individuals vulnerable to dropping out of treatment. It was pointed out that supervised consumption policies were quickly relaxed at the start of Covid-19 restrictions – something that appears to have been done safely and with benefits to service users. It was also highlighted that supervised consumption in OST is inherently stigmatising, as users of other addictive drugs with overdose potential, such as other prescribed opioids and benzodiazepines, are not subjected to the same regulations. This sends a clear message to OST service users that they cannot be trusted. Other key suggestions were:

  • Communicating with CQCs and Royal Colleges, who may be particularly interested in understanding how people are treated in their services.
  • Drawing on existing stigma policies from other arenas e.g. mental health.
  • Highlighting the fiscal benefits of reducing stigma to key decision makers.
  • Tapping into plans for the new Police and Crime Commissioners, who have a trauma sub-group.
  • Linking into work with ADDER areas, which may provide the evidence for ‘what works’.

What next?

I am now planning to apply for further funding to develop an intervention to reduce organisational stigma towards OST service users. The involvement of service users and other key stakeholders will be crucial in every step of that process, so I will be putting together a steering group as well as seeking out collaborations with academics internationally that have expertise and an interest in this area. I was really pleased to see that Dame Carol Black’s second report makes some concrete recommendations around reducing stigma towards people who use drugs. I hope therefore to be able to work with the current momentum to make OST safer and more attractive to those whose lives depend on it.

I’d like to extend my gratitude to all of the attendees at the workshop and to Bristol’s Drug and Alcohol Health Integration Team (HIT) for supporting this event. If you are an individual with lived experience of OST, an academic, or any other stakeholder working in this area and would like to be involved with future developments, please get in touch with me at vicky.carlisle@bristol.ac.uk or find me on Twitter at @Vic_Carlisle.

References

Carlisle, V., Maynard, O., Padmanathan, P., Hickman, M., Thomas, K. H., & Kesten, J. (2020, September 7). Factors influencing recovery in opioid substitution treatment: a systematic review and thematic synthesis. https://doi.org/10.31234/osf.io/f6c3p

Scott, J & Carlisle, V (2021). A pharmacy resolution for 2021: let’s improve the way patients with addiction are treated. The Pharmaceutical Journal. https://pharmaceutical-journal.com/article/opinion/a-pharmacy-resolution-for-2021-lets-improve-the-way-patients-with-addiction-are-treated

Sumnall, H. R., Hamilton, I., Atkinson, A. M., Montgomery, C., & Gage, S. H. (2021). Representation of adverse childhood experiences is associated with lower public stigma towards people who use drugs: an exploratory experimental study. Drugs: Education, Prevention and Policy, 28(3), 227-239. https://doi.org/10.1080/09687637.2020.1820450

This blog was originally posted on the TARG blog on the 1 October 2021.

Underestimation of Drug Use: A Perennial Problem with Implications for Policy

by Olivia Maynard

Follow Olivia on Twitter

Photo by Louie Castro-Garcia on Unsplash

In a paper recently published in the journal Addiction, Hannah Charles and colleagues suggest that the prevalence of illicit drug use among 23-25 year olds in a Bristol-based birth cohort (ALSPAC) is over twice that reported in the Crime Survey for England and Wales (CSEW). The team propose that these figures reflect under-reporting in the CSEW, although they note that they may reflect higher levels of illicit drug use in Bristol. Here I present some preliminary data supporting their view that the CSEW underestimates illicit drug use.

In March 2020, I recruited 683 UK university students to participate in a short survey on drug use via the online survey platform Prolific which has been shown to produce reliable data. I recruited only students aged 18 to 24 years who reported using alcohol in the past 30 days, and participants reported whether they had used any of MDMA/ecstasy, cocaine or cannabis in the past two years.

Table 1. Prevalence of self-reported illicit drug use across three surveys of young people in the UK

University
students
via ProlificAged 18-24
Bristol, ALSPAC

Aged 23-25

CSEW

Aged 23-25

2 years 1 year Lifetime 1 year Lifetime
Any illicit drug usea 52.7 (360) 36.7 62.8 16.4 40.6
Cannabis 50.2 (343) 29.2 60.5 13.8 37.3
MDMA/ecstasy/amphetaminesb 23.3 (159) 17.0 32.9 3.6 11.1
Cocaine 21.1 (144) 19.6 30.8 4.8 13.9

Notes: Values represent percentage of participants (number of participants). Percentages for CSEW and ALSPAC are taken from Charles et al (1) and are weighted percentages.
a ‘Any illicit drug use’ refers only to the illicit drugs assessed in the respective surveys (only cannabis, MDMA and cocaine in our survey), more drugs in ALSPAC and CSEW – see Charles et al (1).
Our Prolific survey asked about ‘MDMA / ecstasy’ use, ALSPAC categorised ecstasy/MDMA use along with other ‘amphetamine’ use and CSEW asked about ‘ecstasy’ use.

Over half of my sample reported using at least one of cannabis, cocaine or MDMA in the past two years (Table 1). This is markedly higher than the CSEW’s estimates of either past year or lifetime use, and more in line with those reported in ALSPAC. Comparing across drugs, past two-year use of the three drugs is higher in my survey than either past year or lifetime use in the CSEW, and higher than past year, but lower than lifetime use in ALSPAC. Perhaps of more interest than ever use of the drugs over the past two years, I also examined the combinations of drugs students in my survey were using (Table 2). I find that the majority of students who report using illicit drugs have only used cannabis in the past two years (25% of all students), although the second largest group (15%) have used all three of cannabis, MDMA and cocaine.

Table 2. Prevalence of self-reported illicit drug among UK university students

Qualtrics survey of university students (past two years)
All
(n=683)
Female
(n=336)
Male
(n=312)
Other
(n=35)
Illicit drug use 
Cannabis 50.2 (343) 48.5 (163) 53.5 (167) 37.1 (13)
MDMA / ecstasy 23.3 (159) 19.3 (65) 29.2 (91) 8.6 (3)
Cocaine 21.1 (144) 17.6 (59) 26 (81) 11.4 (4)
Illicit drug use profiles
Alcohol only (no illicit drug use) 47.3 (323) 48.2 (162) 44.6 (139) 62.9 (22)
Any illicit drug usea 52.7 (360) 51.8 (174) 55.4 (173) 37.1 (13)
Cannabis only 24.5 (167) 27.4 (92) 21.5 (67) 22.9 (8)
Cannabis + Cocaine + MDMA 15.4 (105) 11.3 (38) 20.8 (65) 5.7 (2)
Cannabis + MDMA 6.3 (43) 6 (20) 7.1 (22) 2.9 (1)
Cannabis + Cocaine 4.1 (28) 3.9 (13) 4.2 (13) 5.7 (2)
Cocaine only 0.9 (6) 1.2 (4) 0.6 (2) 0 (0)
MDMA only 0.9 (6) 0.9 (3) 1 (3) 0 (0)
Cocaine + MDMA 0.7 (5) 1.2 (4) 0.3 (1) 0 (0)

Notes: Values represent percentage of participants (number of participants).
‘Illicit drug use’ refers to participants reporting any use of the three drugs in the past two years.
‘Illicit drug use profiles’ refers to the combinations of drugs participants report using in the past two years.
a ‘Any illicit drug use’ refers only to use of cannabis, MDMA and cocaine.

There are some important differences between my sample and both the CSEW and ALSPAC samples. Some differences may mean that my figures are overestimates, including sampling university students who are more affluent than the general population (although drug use is not necessarily higher among students than non-students) and only including those who reported drinking alcohol (although according to the study authors, over 95% of the ALSPAC participants report past year drinking). Other differences may mean my figures are underestimates, including only asking about use of three drugs (thereby underestimating ‘any illicit drug use’), and the younger average age of my sample. I also report on past two-year use, rather than either lifetime or past year use as per CSEW and ALSPAC. Given these differences, I would like to run a larger, more representative sample on the Prolific platform (Prolific allows researchers to recruit a sample which is representative of the general population), to get an estimate of illicit drug use which is more comparable to ALSPAC and CSEW.

Despite these differences, my data support those reported by Charles and colleagues. Indeed, I find it unsurprising that illicit drug use is under-reported in the Home Office’s CSEW. The validity of self-reports for sensitive issues has long been a concern. Over-reporting of illicit drug use is not considered to be a concern and numerous methods have been developed for preventing under-reporting (see a 1997 NIDA report on this issue, as well as more recent techniques for estimating prevalence of use such as the crosswise method). It is important to consider the context in which surveys are administered, including participants’ perception of who is asking the questions and for what reason. It seems that if drug use is asked about in a research context, (e.g., with a clear research objective, informed consent and no possibility of repercussions), the validity of responses may be higher than when questions are asked by organisations that are perceived to be involved in the punishment of people who use drugs (e.g., governments, universities).

While the CSEW recognises that it does not reliably measure problematic drug use, my data and that of Charles and colleagues provide evidence that CSEW’s claim that it is a ‘good measure of recreational drug use’ may be wrong. Although it may be convenient to believe that only a small subset of the population uses illicit drugs, accurate information may galvanise policy makers (both nationally and locally, including at universities) into developing drugs policies that reflect reality and which support, rather than criminalise, the large proportion of the population who choose to use drugs. Indeed, this is what we’re doing at the University of Bristol, where it has been accepted that drug use is relatively common among our students and we’re providing support and education to those students who need it.


This blog posted was originally posted on the Tobacco and Alcohol Research Group blog

COVID19 – should schools close early for Christmas?

Sarah Lewis, Marcus Munafo and George Davey Smith


We have previously written about the limited risk posed to pupils, teachers and the community by schools being open during the Covid19 pandemic. Schools have now been open for almost a full academic term (3 months), so it is time to take another look at the evidence.

School re-openings have coincided with an increase in Covid19 infection rates across all UK nations. This rise in infection rates was anticipated, given the annual pattern of rising respiratory infections in the autumn term. There was also a rapid increase in Covid19 testing rates as children returned to school and presented with mild symptoms. Rates of positivity among children were very low at first, but a rise was observed over the autumn. This corresponded with an increase in rates among adults, and there seems to be a strong correlation between Covid19 positivity in schools and rates in the local community.

But has transmission of Covid19 in schools driven the second wave? And should schools be closed again to reduce infection in the community?

This post argues that there is little case for closing schools, as

  • Schools don’t seem to drive transmission in the community
  • The risk of the virus to most school children is very low
  • The harms of school closures are wide ranging.
Photo by CDC on Unsplash

Infection rates among children have been low

Since September children with COVID19 symptoms have been asked to stay at home and have a test before returning to school. Tests equating to 10% of the school pupil population were carried out during first half term in Scotland; only 0.2% of pupils tested positive during this period. Similarly high volumes of testing have been carried out in Wales, but only 0.6% of pupils tested positive between 1st September and 9th December 2020. Pupils made up 3.5% of cases in Wales over that period, despite making up 16% of the population.

However, the weekly Covid19 incidence among 12-16 year olds in Wales was similar to the national average for the week ending 9th December 2020, suggesting a change in the age demographic of cases.

Transmission levels in school have been low

It is unclear what proportion of children who tested positive contracted the infection in school – many children have similar social circles both in and out of school. When infections are found in schools, most schools have only 1 or 2 cases within a 2-week period (unless levels in the local community are high). This suggests low levels of transmission in schools.

Children and adults have different symptoms

Comparisons of rates of infection between children and adults should be treated with caution. Cases are diagnosed using recognised Covid19 symptoms, and are influenced by the volume of testing in the community. Younger children seem to be less likely to have symptoms – around 50% of infected children tend to be completely asymptomatic.  They also may have somewhat different pattern of symptoms to adults – fatigue, gastrointestinal symptoms, and changes in sense of smell or taste, but only rarely a cough. Therefore, studies relying on symptoms in children may be unreliable.

Random testing is the best way to find out level of infection

Surveys show that while young adults had the highest levels of infection in September, secondary school pupils now have the highest rates.

Studies which test individuals at random in the community are more reliable indicators of the levels of infection among children compared to adults. The UK Office of National Statistics (ONS) infection survey has been randomly testing people from the community since early May. It showed that young adults (school year 11 to age 24) had the highest positivity rates in September. This became more pronounced in early October when universities re-opened to students. By the end of October, rates among secondary school pupils were similar to those in young adults, at around 2%. Secondary school pupils now have the highest rates. Covid19 positive rates among primary school children are about half those in secondary school children and have barely changed since the beginning of the academic year.

Infection rates among teachers

There is no evidence that teachers are more at risk of death from COVID19, and infection rates among teachers do not seem higher than other professions.

ONS data from the first wave of the COVID19 epidemic in the UK showed that teachers were not at increased risk of death from the disease compared to other professionals. Based on ONS data, during October those working in the education sector had an antibody positivity rate of 8.1% (95% CI 5.9-10.8) compared with 6.5% (95% CI 5.9-7.3) among those working in other professions. This suggests perhaps slightly higher infection rates, but this is estimated with uncertainty.

Infection positivity rates – also measured by the ONS survey –  from 2nd September to 16th October showed that teachers were no more likely to test positive than other professions, although again there was a lot of uncertainty in these estimates*.  The Swedish Public Health Agency have linked data on Covid19 infection to occupational data and found no increase in infection rates among teachers, although there was some evidence of an increase in infection rates among teaching assistants, school counsellor and  headteachers. However, infection rates may have been inflated relative to other profession if there is  increased testing among asymptomatic people in the education sector.

Photo by Jeswin Thomas on Unsplash

Could infections in schools be driving community infection rates?

The evidence suggests this is unlikely.

Infection rate increases appear to coincide with school openings, but the R-number was increasing in Scotland and England before school openings. Hospital admissions due to Covid19 had also started to rise before this point. In September, positivity rates were initially highest among young adults, not among children of school age, suggesting that perhaps infections among school children were not driving community rates. The ONS data showed infection rates levelling off over October half term, and climbing again among young adults and secondary school children after half term. However, this trend was not as marked in primary school children, and was not observed in adults, even amongst the 35-49 year age group, to which many parents of school aged children belong. Another study of community-based testing – the REACT-1 study – found a greater decrease in infections among younger children compared with older children following the October half term holiday, but again there was a lot of uncertainty in this estimate.

Contact mixing patterns show that people tend to have the most contacts within the same age group, followed by the age group closest to them. Children have more opportunities to pass on the infection to other children and young adults, and are not significantly influencing rates in older adults.

The current R-number in England is currently estimated to be slightly below 1 despite schools being open. This shows that it is possible to drive down infection rates in the community whilst keeping schools open. Furthermore, when everything else but schools are closed – such as in the case of the national lockdown which occurred in England in November, school children will have more contacts than anyone else and schools will contribute to relatively more transmissions in the community even if transmission rates are low overall.

Closing schools is not the answer

Rates have recently fallen among adults in England, despite schools remaining open and secondary school rates increasing. The evidence suggests low levels of virus transmission within schools. First Minister of Wales Mark Drakeford recently said that behavioural evidence suggests closing schools could place some children “in even riskier environments”. Children being looked after by their grandparents rather than being in school would be more dangerous in terms of the virus being transmitted to a higher risk group.

Any public health intervention should consider the costs as well as the benefits. We know that school closures have wide ranging adverse consequences for children and families as outlined by UNESCO, and such costs are particularly pronounced for the poorest and most vulnerable children in society. Children:

  • who do not have access to technology to participate in online learning
  • whose parents who do not have the resources or the educational background to help

have been shown to fall further behind following school closures. Evidence suggests that children’s mental health deteriorated during the first lockdown, and that vulnerable children were at greater risk of violence and exploitation. School closures can also cause economic hardship due to parents being unable to work.  This has prompted Robert Jenkins Global Chief of Education at UNICEF to issue a statement over the last few days saying:

“Evidence shows that schools are not the main drivers of this pandemic. Yet, we are seeing an alarming trend whereby governments are once again closing down schools as a first recourse rather than a last resort. In some cases, this is being done nationwide, rather than community by community, and children are continuing to suffer the devastating impacts on their learning, mental and physical well-being and safety”.

If schools being open are not major drivers of transmission in the community (which they don’t appear to be), given that the risk of the virus to most school children is very low, there is very little case for closing them given the potential harm this could cause.

Footnote: Secondary schools in Wales were closed early for Christmas on the 11th December 2020

*(estimates ranged from 0.2% (95%CI=0.07-0.53) for primary school teachers to 0.5% teachers of unknown type (95% CI=0.36-0.69) compared with 0.4% (95%=0.39-0.49) for all other professions)

Are schools in the COVID-19 era safe?

Sarah Lewis, Marcus Munafo and George Davey Smith

Follow Sarah, George and Marcus on Twitter

The COVID-19 pandemic caused by the SARS-COV2 virus in 2020 has so far resulted in a heavy death toll and caused unprecedented disruption worldwide. Many countries have opted for drastic measures and even full lockdowns of all but essential services to slow the spread of disease and to stop health care systems becoming overwhelmed. However, whilst lockdowns happened fast and were well adhered to in most countries, coming out of lockdown is proving to be more challenging. Policymakers have been trying to balance relaxing restriction measures with keeping virus transmission low. One of the most controversial aspects has been when and how to reopen schools.

Many parents and teachers are asking: Are schools safe?

The answer to this question depends on how much risk an individual is prepared to accept – schools have never been completely “safe”. Also, in the context of this particular pandemic, the risk from COVID-19 to an individual varies substantially by age, sex and underlying health status. However, from a historical context, the risk of death from contracting an infectious disease in UK schools (even in the era of COVD-19) is very low compared to just 40 years ago, when measles, mumps, rubella and whooping cough were endemic in schools. Similarly, from a global perspective UK schools are very safe – in Malawi, for example, the mortality rate for teachers is around five times higher than in the UK, with tuberculosis causing more than 25% of deaths among teachers.

In this blog post we use data on death rates to discuss safety, because there is currently better evidence on death rates by occupational status than, for example, infection rates. This is because death rates related to COVID-19 have been consistently reported by teh Office for National Statistics, whereas data on infection rates depends very much on the level of testing in the community (which has changed over time and differs by region).

Risks to children

Thankfully the risk of serious disease and death to children throughout the pandemic, across the UK and globally, has been low. Children (under 18 years) make up around 20% of the UK population, but account for only around 1.5% of those hospitalised with COVID-19. This age group have had better outcomes according to all measures compared to adults. As of the 12th June 2020, there have been 6 deaths in those with COVID-19 among those aged under 15 years across England and Wales. Whilst extremely sad, these deaths represent a risk of around 1 death per 2 million children. To place this in some kind of context, the number of deaths expected due to lower respiratory tract infections among this age group in England and Wales over a 3 month period is around 50 and 12 children would normally die due to road traffic accidents in Great Britain over a 3-month period.

Risks to teachers

Our previous blog post concluded that based on available evidence the risk to teachers and childcare workers within the UK from Covid-19 did not appear to be any greater than for any other group of working age individuals. It considered mortality from COVID-19 among teachers and other educational professionals who were exposed to the virus prior to the lockdown period (23rd March 2020) and had died by the 20th April 2020 in the UK. This represents the period when infection rates were highest, and when children were attending school in large numbers. There were 2,494 deaths among working-age individuals up to this date, and we found that the 47 deaths among teachers over this period represented a similar risk to all professional occupations – 6.7 (95% CI 4.1 to 10.3) per 100,000 among males and 3.3 (95% CI 2.0 to 4.9) per 100,000 among females.

The Office for National Statistics (ONS) has since updated the information on deaths according to occupation to include all deaths up to the 25th May 2020. The new dataset includes a further 2,267 deaths among individuals with COVID-19. As the number of deaths had almost doubled during this extended period, so too had the risk. A further 43 deaths had occurred among teaching and education professionals, bringing the total number of deaths involving COVID-19 among this occupational group to 90. It therefore appears that lockdown (during which time many teachers have not been in school) has not had an impact on the rate at which teachers have been dying from COVID-19.

As before, COVID-19 risk does not appear greater for teachers than other working age individuals

The revised risk to teachers of dying from COVID-19 remains very similar to the overall risk for all professionals at 12.9 (95% CI 9.3 to 17.4) per 100,000 among all male teaching and educational professionals and 6.0 (95% CI 4.2 to 8.1) per 100,000 among all females, compared with 11.6 (95%CI 10.2 to 13.0) per 100,000 and 8.0 (95%CI 6.8 to 9.3) per 100,000 among all male and female professionals respectively. It is useful to look at the rate at which we would normally expect teaching and educational professionals to die during this period, as this tells us by how much COVID-19 has increased mortality in this group. The ONS provide this in the form of average mortality rates for each occupational group for same 11 week period over the last 5 years.  The mortality due to COVID-19 during this period represents 33% for males and 19% for females of their average mortality over the last 5 years for the same period. For male teaching and educational professionals, the proportion of average mortality due to COVID-19 is very close to the value for all working-aged males (31%) and all male professionals (34%). For females the proportion of average mortality due to COVID-19 is lower than for all working-aged females (25%) and for female professionals (25%). During the pandemic period covered by the ONS, there was little evidence that deaths from all causes among the group of teaching and educational professionals were elevated above the 5-year average for this group.

Teaching is a comparatively safe profession

It is important to note that according to ONS data on adults of working age (20-59 years) between 2001-2011, teachers and other educational professionals have low overall mortality rates compared with other occupations (ranking 3rd  safest occupation for women and 6th for men). The same study found a 3-fold difference between annual mortality among teachers and among the occupational groups with the highest mortality rates (plant and machine operatives for women and elementary construction occupations among men). These disparities in mortality from all causes also exist in the ONS data covering the COVID-19 pandemic period, but were even more pronounced with a 7-fold difference between males teaching and educational professionals and male elementary construction occupations, and a 16-fold difference between female teachers and female plant and machine operatives.

There is therefore currently no indication that teachers have an elevated risk of dying from COVID-19 relative to other occupations, and despite some teachers having died with COVID19, the mortality rate from all causes (including COVID19) for this occupational group over this pandemic period is not substantially higher than the 5 year average.

Will reopening schools increase risks to teachers?

One could argue that the risk to children and teachers has been low because schools were closed for much of the pandemic, and children have largely been confined to mixing with their own households, so that when schools open fully risk will increase. However, infection rates in the community are now much lower than they were at their peak, when schools were fully open to all pupils without social distancing. Studies which have used contract tracing to determine whether infected children have transmitted the disease to others have consistently shown that they have not, although the number of cases included has been small, and asymptomatic children are often not tested. Modelling studies estimate that even if schools fully reopen without social distancing, this is likely to have only modest effects on virus transmission in the community. If infection levels can be controlled – for example by testing and contact tracing efforts – and cases can be quickly isolated, then we believe that schools pose a minimal risk in terms of the transmission of COVID, and to the health of teachers and children. Furthermore, the risk is likely to be more than offset by the harms caused by ongoing disruption to children’s educational opportunities.

Sarah Lewis is a Senior Lecturer in Genetic Epidemiology in the department of Population Health Sciences, and is an affiliated member of the MRC Integrative Epidemiology Unit (IEU), University of Bristol.

Marcus Munafo is a Professor of Biological Psychology, in the School of Psychology Science and leads the Causes, Consequences and Modification of Health Behaviours programme of research in the IEU, University of Bristol.

George Davey Smith is a Professor of Clinical Epidemiology, and director of the MRC IEU, University of Bristol.

Maximum cigarette pack size: a neglected aspect of tobacco control

Written by Anna Blackwell, Senior Research Associate

Follow Bristol Tobacco and Alcohol Research Group (TARG) on twitter

The manufacturing or importing of packs of cigarettes with fewer than 20 cigarettes per pack was prohibited in the UK when the EU Tobacco Products Directive and standardised packaging legislation were fully implemented in May 2017. This change was aimed at reducing the affordability of cigarettes and thereby discouraging young people from smoking. This directive also required the removal of branding and established a standard shape and dark green colour for packaging, including pictorial health warnings, which prevented the use of packaging for promotion and reduced its appeal.

However, the tobacco industry has been able to exploit loopholes in recent packaging regulations, including the absence of a regulated maximum pack size, by introducing non-standard and larger pack sizes to the market to distinguish products. This is a public health concern given evidence that larger pack sizes are linked to increased smoking, and could undermine existing tobacco control success.

Evidence shows that larger pack sizes are linked to increased smoking.

In a recent Addiction Opinion and Debate paper, we proposed that a cap on cigarette pack size should be introduced; a pragmatic solution would be to permit only a single pack size of 20, which is now the minimum in many countries. This approach would reduce the number of cigarettes in packs in several countries such as Australia – where packs up to sizes of 50 are available – and prevent larger sizes being introduced elsewhere.

Capping cigarette pack size therefore has the potential to both reduce smoking and prevent increased smoking. While the health benefits of reducing smoking alone are small, it may have important indirect effects on health through its role in facilitating quitting. Those smoking fewer cigarettes per day are more likely to attempt to quit and succeed in doing so. Trials of smoking-reduction interventions have also found that these can lead to increased quitting when combined with nicotine replacement therapy.

Our Opinion and Debate paper drew on evidence from a range of sources including industry documents and analyses, population surveys, intervention trials and Mendelian randomization analyses. Together these suggest that consumption increases with larger pack size, and cessation increases with reduced consumption. However, direct experimental evidence is not currently available to determine whether pack size influences the amount of tobacco consumed, or whether the association is due to other factors.

People who want to quit may be using smaller packs as a method of self-control, and smokers who successfully cut down and later quit may be more motivated to do so. Cost is also an important factor and larger packs may be linked to increased smoking because they have a lower cost per cigarette. Further research is needed to determine whether the associations between pack size, smoking and cessation are causal to estimate the impact of policies to cap cigarette pack size.

Commentaries on our Opinion and Debate paper, published in the May 2020 Issue of Addiction highlight the need to understand the mechanisms for the associations observed between pack size and smoking in order to identify the optimal cigarette pack size. Although mandating packs of 20 is a pragmatic approach, pack size regulation needs to achieve a compromise between tobacco affordability and smokers’ self-regulation. Nevertheless, the policy debate should start now to address this neglected aspect of tobacco control.

To find out more visit the Behaviour Change by Design website or follow us on Twitter @BehavChangeDsgn @BristolTARG


This blog post is reposted from the TARG blog.

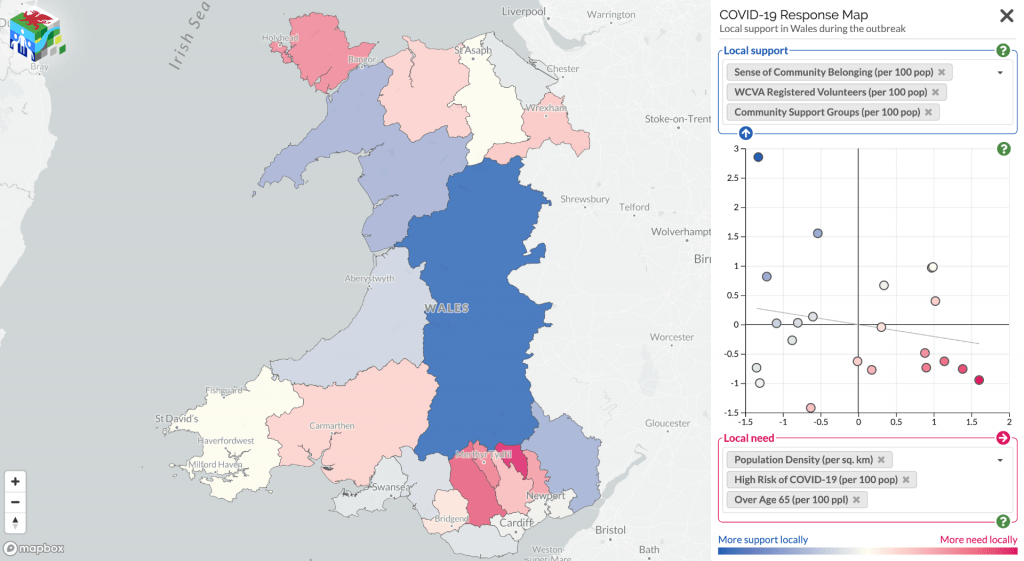
COVID-19 and community support: Mapping unmet support needs across Wales

Dr Oliver Davis, Nina Di Cara, and the project team 

Follow OliverValerioAlastairNina, Chris Benjamin and Public Health Wales Research & Evaluation on Twitter 

Since the pandemic started, communities have been mobilising to help each other; from shopping for elderly neighbours, to offering to offering a friendly face or other support.  Mutual aid networks have sprung up all over the country, and neighbours who hadn’t previously spoken have been introduced to each other via streetlevel WhatsApp groups. But the degree to which offers of help are matching up with the need for help has been unknown, and this poses a problem for organisations who need to make decisions about where they should target limited resources.   

Screenshot from the https://covidresponsemap.wales/ site.

Ensuring support is available where needed 

Community support can offer a protective factor against adverse events. Some areas are more vulnerable than others, but knowing which areas are most likely to have a mismatch between support needed and support offered is difficult. To address this issue, a collaboration between the Public Health Wales Research & Evaluation Division and the Dynamic Genetics lab, part of the MRC Integrative Epidemiology Unit at the University of Bristol and supported by the Alan Turing Institute, has mapped these support offers and needs 

Using data from Wales Council for Voluntary Action, COVID-19 Mutual Aid, Welsh Government Statistics and Research, the Office for National Statistics, and social media the project team have created a live map that highlights the areas where further support for communities may be needed. It shows data on support factors, such as number of registered volunteers and population density, against risks, such as demographics, levels of deprivation, and internet access. It aims to inform the responses of national and local government, as well as support providers in Wales. 

The site also provides the links to local community groups identified helping to raise awareness of the support available locally. 

This map is part of an effort to better understand which communities have better community cohesion and organisation. We are keen to find out your views on how this can be more useful, or other community mobilisation data sources which could be included. Please contact Oliver or Nina with your comments: 

Dr Oliver Davis: oliver.davis@bristol.ac.uk  

Nina Di Cara nina.dicara@bristol.ac.uk 


Further information 


Are teachers at high risk of death from Covid19?

Sarah Lewis, George Davey Smith and Marcus Munafo

Follow Sarah, George and Marcus on Twitter

Due to the SARS-CoV-2 pandemic schools across the United Kingdom were closed to all but a small minority of pupils (children of keyworkers and vulnerable children) on the 20th March 2020, with some schools reporting as few as 5 pupils currently attending. The UK government have now issued guidance that primary schools in England should start to accept pupils back from the 1st June 2020 with a staggered return, starting with reception, year 1 and year 6.

Concern from teachers’ unions

This has prompted understandable concern from the  teachers’ unions, and on the 13th May, nine unions which represent teachers and education professionals signed a joint statement calling on the government to postpone reopening school on the 1st June, “We all want schools to re-open, but that should only happen when it is safe to do so. The government is showing a lack of understanding about the dangers of the spread of coronavirus within schools, and outwards from schools to parents, sibling and relatives, and to the wider community.” At the same time, others have suggested that the harms to many children due to neglect, abuse and missed educational opportunity arising from school closures outweigh the small increased risk to children, teachers and other adults of catching the virus.

What risk does Covid19 pose to children?

Weighing up the risks to children and teachers

So what do we know about the risk to children and to teachers? We know that children are about half as likely to catch the virus from an infected person as adults, and  if they do catch the virus they  are likely to have only mild symptoms.  The current evidence, although inconclusive, also suggests that they may be less likely to transmit the virus than adults.  However, teachers have rightly pointed out that there is a risk of transmission between the teachers themselves and between parents and teachers.

The first death from COVID-19 in England was recorded at the beginning of March 2020 and by the 8th May 2020 39,071 deaths involving COVID-19 had been reported in England and Wales. Just three of these deaths were among children aged under 15 years and  only a small proportion of the deaths (4416 individuals, 11.3%) were among working aged people.  Even among this age group risk is not uniform; it increases sharply with age from 2.6 in 100,000 for 25-44 years olds with a ten fold increase to 26 in  100,000 individuals for those aged 45-64.

Risks to teachers compared to other occupations

In addition, each underlying health condition increases the risk of dying from COVID-19, with those having at least 1 underlying health problem making up most cases.   The Office for National Statistics in the UK have published age standardised deaths by occupation for all deaths involving COVID-19 up to the 20th April 2020. Most of the people dying by this date would have been infected at the peak of the pandemic in the UK  prior to the lockdown period. They found that during this period there were 2494 deaths involving Covid-19 in the working age population. The mortality rate for Covid-19 during this period was 9.9 (95% confidence intervals 9.4-10.4) per 100,000 males and 5.2 (95%CI 4.9-5.6) per 100,000 females, with Covid-19 involved in around 1 in 4 and 1 in 5 of all deaths among males and females respectively.

Amongst teaching and education professionals (which includes school teachers, university lecturers and other education professionals) a total of 47 deaths (involving Covid-19) were recorded, equating to mortality rates of 6.7 (95%CI 4.1-10.3) per 100,000 among males and 3.3 (95%CI 2.0-4.9) per 100,000 among females, which was very similar to the rates of 5.6 (95%CI 4.6-6.6) per 100,000 among males and 4.2(95%CI 3.3-5.2) per 100,000 females for all professionals. The mortality figures for all education professionals includes 7 out of 437000 (or 1.6 per 100,000 teachers) primary and nursery school teachers and 17 out of 395000 (or 4.3 per 100,000 teachers) secondary school teachers.  A further 20 deaths occurred amongst childcare workers giving a mortality rate amongst this group of 3.4 (95%CI=2.0-5.5) per 100,000 females (males were highly underrepresented in this group), this is in contrast to rates of 6.5 (95%CI=4.9-9.1) for female sales assistants and 12.7(95%CI= 9.8-16.2) for female care home workers.

Covid-19 risk does not appear greater for teachers than other working age individuals

In summary, based on current evidence the risk to teachers and childcare workers within the UK from Covid-19 does not appear to be any greater than for any other group of working age individuals. However, perceptions of elevated risk may have occurred, prompting some to ask “Why are so many teachers dying?” due to the way this issue is portrayed in the media with headlines such as “Revealed: At least 26 teachers have died from Covid-19” currently on the https://www.tes.com website. This kind of reporting, along with the inability of the government to communicate the substantial differences in risk between different population groups – in particular according to age – has caused understandable anxiety among teachers. Whilst, some teachers may not be prepared to accept any level of risk of becoming infected with the virus whilst at work, others may be reassured that the risk to them is small, particularly given that we all accept some level of risk in our lives, a value that can never be zero.

Likely impact on transmission in the community is unclear

As the majority of parents or guardians of school aged children will be in the 25-45 age range, the risk to them  is also likely to be small. Questions remain however around the effect of school openings on transmission in the community and the associated risk. This will be affected by many factors including the existing infection levels in the community, the extent to which pupils, parents and teachers are mixing outside of school (and at the school gate) and mixing between individuals of different age groups. This is the primary consideration of the government Scientific Advisory Group for Emergencies (SAGE) who are using modelling based on a series of assumptions to determine the effect of school openings on R0.


Sarah Lewis is a Senior Lecturer in Genetic Epidemiology in the department of Population Health Sciences, and is an affiliated member of the MRC Integrative Epidemiology Unit (IEU), University of Bristol

George Davey Smith is a Professor of Clinical Epidemiology, and director of the MRC IEU, University of Bristol

Marcus Munafo is a Professor of Biological Psychology, in the School of Psychology Science and leads the Causes, Consequences and Modification of Health Behaviours programme of research in the IEU, University of Bristol.


New evidence on risks of low-level alcohol use in pregnancy

Dr Kayleigh Easey (@KayEasey), from the Bristol Medical School’s MRC Integrative Epidemiology Unit at the University of Bristol, takes a look at a recent research investigating effects of drinking in pregnancy and child mental health.

Whilst it’s generally known that heavy alcohol use during pregnancy can cause physical and cognitive impairments in offspring, there has been relatively limited evidence about the effects of low to moderate alcohol use. As such there have been conflicting conclusions about the potential harm of drinking in pregnancy, and debate around official guidance.

Alcohol use in pregnancy is still common with a recent meta-analysis showing over 40% of women within the UK to have drank some alcohol whilst pregnant. In 2016 the Department of Health updated their guidance advising abstinence from alcohol throughout pregnancy. This was in contrast to their previous advice of abstaining from alcohol in the first three months, but that 1-2 units of alcohol per week were not likely to cause harm. The updated guidance reflected a precautionary approach based on researcher’s advice of ‘absence of evidence not being evidence of absence’, due to the challenges faced in this area of study.

Certainly it has been challenging for researchers to determine any causal effect of alcohol use in pregnancy, particularly as the existing observational studies do not show evidence of causality. As such, caution over interpretation of results is needed given the sensitivity of alcohol as a risk factor and traditional attitudes towards low-level drinking.

Our new research sought to add to the limited body of evidence investigating causal effects, specifically on how low to moderate alcohol use could influence offspring mental health. We used data from a longitudinal birth cohort (the Avon Longitudinal Study of Parents and Children) which has followed pregnant mothers, their partners and their offspring since the 1990s, to investigate whether the frequency mothers and their partners drank alcohol during pregnancy was associated with offspring depression at age 18. We also included partner’s alcohol use in pregnancy (which is unlikely to have a direct biological effect on the developing fetus) and were able to examine if associations were likely to be causal, or due to shared confounding factors between parents such as socio-demographic factors.

We found that children whose mothers drank any alcohol at 18 weeks pregnancy may have up to a 17% higher risk of depression at age 18 compared to those mothers who did not drink alcohol. What was really interesting here is that we also investigated paternal alcohol use during pregnancy and did not find a similar association. This suggests that the associations seen with maternal drinking may be causal, rather than due to confounding by other factors (which might be expected to be similar between mothers and their partners). Many of the indirect factors that could explain the maternal effects are shared between mothers and partners (such as socio-demographic factors); despite this, we only found associations for mothers drinking.

These findings suggest evidence of a likely causal effect from alcohol consumption during pregnancy, and therefore evidence to support the updated government advice that the safest approach for alcohol use during pregnancy is for abstinence. This adds to other limited research on the effects of low level alcohol use in pregnancy. Whilst further research is needed, women can use this information to further inform their choices and help avoid risk from alcohol use both during pregnancy and as a precautionary measure when trying to conceive, as supported by the #Drymester campaign.

Our study highlights also the importance of including partner behaviours during pregnancy to aid in identifying causal relationships with offspring outcomes, and also because these may be important in their own right. I am currently working within the EPoCH project (Exploring Parental Influences on Childhood Health) which investigates whether and how both maternal and paternal behaviours might impact childhood health. In the meantime, it may be time for a further public health promotion highlighting that an alcohol-free pregnancy really is safer for children’s health.


This post was originally published on the Alcohol Policy blog.

What can genetics tell us about how sleep affects our health?

Deborah Lawlor, Professor of Epidemiology, Emma Anderson, MRC Research Fellow, Marcus Munafò, Professor of Experimental Psychology, Mark Gibson, PhD student, Rebecca Richmond, Vice Chancellor’s Research Fellow

Follow Deborah, Marcus, and Rebecca on Twitter

Association is not causation – are we fooled (confounded) when we see associations between sleep problems and disease?

Sleep is important for health. Observational studies show that people who report having sleep problems are more likely to be overweight, and have more health problems including heart disease, some cancers and mental health problems.

A major problem with conventional observational studies is that we cannot tell whether these associations are causal; does being overweight cause sleep problems, or do sleep problems cause people to become overweight? Alternatively, factors that influence how we sleep may also influence our health. For example, smoking might cause sleep problems as well as heart disease and so we are fooled (confounded) into thinking sleep problems cause heart disease when it is really all explained by smoking. In the green paper Advancing our Health: Prevention in the 2020s, the UK Government acknowledged that sleep has had little attention in policy, and that causality between sleep and health is likely to run in both directions.

But, how can we determine the direction of causality for sure? And, how do we make sure we are results are not confounded?

Randomly allocated genetic variation

Our genes are randomly allocated to us from our parents when we are conceived. They do not change across our lifespan, and cannot be changed by smoking, overweight or ill health.

Here at the MRC Integrative Epidemiology Unit we have developed a research method called Mendelian randomization, which uses this family-level random allocation of genes to explore causal effects. To find out more about Mendelian randomization take a look at this primer from the Director of the Unit (Prof George Davey Smith).

In the last two years, we and colleagues from the Universities of Manchester, Exeter and Harvard have identified large numbers of genetic variants that relate to different sleep characteristics. These include:

  • Insomnia symptoms
  • How long, on average, someone sleeps each night
  • Chronotype (whether someone is an ‘early bird’ or ‘lark’ and prefers mornings, or a ‘night owl’ and prefers evenings). Chronotype is thought to reflect variation in our body clock (known as circadian rhythms).

We can use these genetic variants in Mendelian randomization studies to get a better understanding of whether sleep characteristics affect health and disease.

What we did

In our initial studies we used Mendelian randomization to explore the effects of sleep duration, insomnia and chronotype on body mass index, coronary heart disease, mental health problems, Alzheimer’s disease, and breast cancer. We analysed whether the genetic traits that are related to sleep characteristics – rather than the sleep characteristics themselves – are associated with the health outcomes. We combined those results with the effect of the genetic variants on sleep traits which allows us to estimate a causal effect. Using genetic variants rather than participants’ reports of their sleep characteristics makes us much more certain that the effects we identify are not due to confounding or reverse causation.

Are you a night owl or a lark?

What we found

Our results show a mixed picture; different sleep characteristics have varying effects on a range of health outcomes.

What does this mean?

Having better research evidence about the effects of sleep traits on different health outcomes means that we can give better advice to people at risk of specific health problems. For example, developing effective programmes to alleviate insomnia may prevent coronary heart disease and depression in those at risk. It can also help reduce worry about sleep and health, by demonstrating that some associations that have been found in previous studies are not likely to reflect causality.

If you are worried about your own sleep, the NHS has some useful guidance and signposting to further support.

Want to find out more?

Contact the researchers

Deborah A Lawlor mailto:d.a.lawlor@bristol.ac.uk

Further reading

This research has been published in the following open access research papers:

Genome-wide association analyses of chronotype in 697,828 individuals provides insights into circadian rhythms. Nature Comms (2019) https://www.nature.com/articles/s41467-018-08259-7

Biological and clinical insights from genetics of insomnia symptoms.  Nature Gen. (2019) https://www.ncbi.nlm.nih.gov/pmc/articles/PMC6415688/

Genome-wide association study identifies genetic loci for self-reported habitual sleep duration supported by accelerometer-derived estimates. Nature Comms. (2019) https://www.nature.com/articles/s41467-019-08917-4

Investigating causal relations between sleep traits and risk of breast cancer in women: mendelian randomisation study. BMJ (2019) https://www.bmj.com/content/365/bmj.l2327

Is disrupted sleep a risk factor for Alzheimer’s disease? Evidence from a two-sample Mendelian randomization analysis. https://www.biorxiv.org/content/10.1101/609834v1 (open access pre-print)

Evidence for Genetic Correlations and Bidirectional, Causal Effects Between Smoking and Sleep Behaviors. Nicotine and Tobacco (2018) https://www.ncbi.nlm.nih.gov/pmc/articles/PMC6528151/

Do development indicators underlie global variation in the number of young people injecting drugs?

Dr Lindsey Hines, Sir Henry Wellcome Postdoctoral Fellow in The Centre for Academic Mental Health & the Integrative Epidemiology Unit, University of Bristol

Dr Adam Trickey, Senior Research Associate in Population Health Sciences, University of Bristol

Follow Lindsey on Twitter

Injecting drug use is a global issue: around the world an estimated 15.6 million people inject psychoactive drugs. People who inject drugs tend to begin doing so in adolescence, and countries that have larger numbers of adolescents who inject drugs may be at risk of emerging epidemics of blood borne viruses unless they take urgent action. We mapped the global differences in the proportion of adolescents who inject drugs, but found that we may be missing the vital data we need to protect the lives of vulnerable young people. If we want to prevent HIV, hepatitis C, and overdose from sweeping through a new generation of adolescents we urgently need many countries to scale up harm reduction interventions, and to collect accurate which can inform public health and policy.

People who inject drugs are engaging in a behaviour that can expose them to multiple health risks such as addiction, blood-borne viruses, and overdose, and are often stigmatised. New generations of young people are still starting to inject drugs, and young people who inject drugs are often part of other vulnerable groups.

Much of the research into the causes of injecting drug use focuses on individual factors, but we wanted to explore the effect of global development on youth injecting. A recent systematic review showed wide country-level variation in the number of young people who comprise the population of people who inject drugs. By considering variation in countries, we hoped to be able to inform prevention and intervention efforts.

It’s important to note that effective interventions can reduce the harms of injecting drug use. Harm reduction programmes provide clean needles and syringes to reduce transmission of blood borne viruses. Opiate substitution therapy seeks to tackle the physical dependence on opiates that maintains injecting behaviour and has been shown to improve health outcomes.

What we did

Through a global systematic review and meta-analysis we aimed to find data on injecting drug use in published studies, public health and policy documents from every country. We used these data to estimate the global percentage of people who inject drugs that are aged 15-25 years old, and also estimated this for each region and country. We wanted to understand what might underlie variation in the number of young people in populations of people who inject drugs, and so we used data from the World Bank to identify markers of a country’s wealth, equality, and development.

What we found

Our study estimated that, globally, around a quarter of people who inject drugs are adolescents and young adults. Applied to the global population, we can estimate approximately 3·9 million young people inject drugs. As a global average, people start injecting drugs at 23 years old.

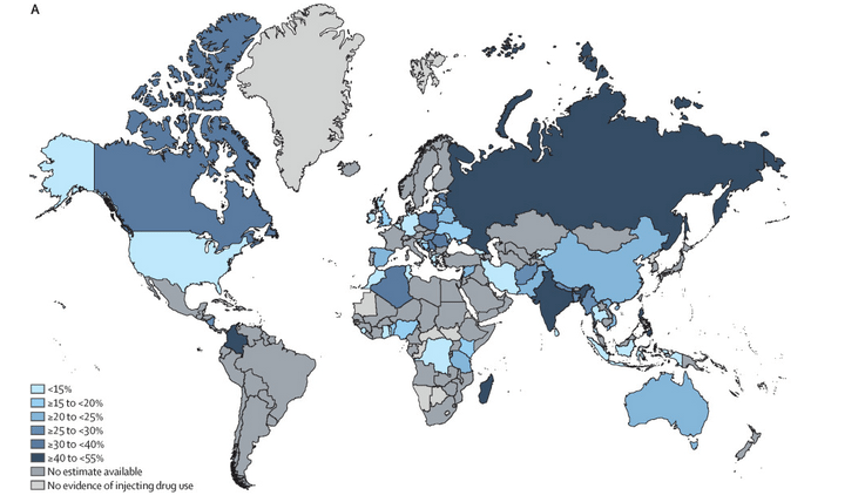
Estimated percentage of young people amongst those who inject drugs in each country

We found huge variation in the percentage of young people in each country’s population of people who inject drugs. Regionally, Eastern Europe had the highest proportion of young people amongst their populations who inject drugs, and the Middle Eastern and North African region had the lowest. In both Russia and the Philippines, over 50% of the people who inject drugs were aged 25 or under, and the average age of the populations of people who inject drugs was amongst the lowest observed.

Average age of the population of people who inject drugs in each country

In relation to global development indicators, people who inject drugs were younger in countries with lower wealth (indicated through Gross Domestic Product per capita) had been injecting drugs for a shorter time period. In rapidly urbanising countries (indicated through urbanisation growth rate) people were likely to start injecting drugs at later ages than people in countries with a slower current rate of urbanisation. We didn’t find any relationships between the age of people who inject drugs and a country’s youth unemployment, economic equality, or level provision of opiate substitution therapy.

However, many countries were missing data on injecting age and behaviours, or injecting drug use in general, which could affect these results.

What this means

1. The epidemic of injecting drug use is being maintained over time.

A large percentage of people who inject drugs are adolescents, meaning that a new generation are being exposed to the risks of injecting – and we found that this risk was especially high in less wealthy countries.

2. We need to scale up access to harm reduction interventions

There are highly punitive policies towards drug use in the countries with the largest numbers of young people in their populations of people who inject drugs. Since 2016, thousands of people who use drugs in the Philippines have died at the hands of the police. In contrast, Portugal has adopted a public health approach to drug use and addiction for decades, taking the radical step of taking people caught with drugs or personal use into addiction services rather than prisons. The rate of drug-related deaths and HIV infections in Portugal has since plummeted, as has the overall rate of drug use amongst young people: our data show that Portugal has a high average age for its population of people who inject drugs. If we do not want HIV, hepatitis C, and drug overdoses to sweep through a new generation of adolescents, we urgently need to see more countries adopting the approach pioneered by Portugal, and scaling up access to harm reduction interventions to the levels recommended by the WHO.

3. We need to think about population health, and especially mental health, alongside urban development.

Global development appears to be linked to injecting drug use, and the results suggest that countries with higher urbanisation growth are seeing new, older populations beginning to inject drugs. It may be that changes in environment are providing opportunities for injecting drug use that people hadn’t previously had. It’s estimated that almost 70% of the global population will live in urban areas by 2050, with most of this growth driven by low and middle-income countries.

4. We need to collect accurate data

Despite the health risks of injecting drug use, and the urgent need to reduce risks for new generations, our study has revealed a paucity of data monitoring this behaviour. Most concerning, we know the least about youth injecting drug use in low- and middle-income countries: areas likely to have the highest numbers of young people in their populations of people who inject drugs. Due to the stigma and the illicit nature of injecting drug use it is often under-studied, but by failing to collect accurate data to inform public health and policy we are risking the lives of vulnerable young people.

Contact the researchers

Lindsey.hines@bristol.ac.uk

Lindsey is funded by the Wellcome Trust.