COVID19 – should schools close early for Christmas?

Sarah Lewis, Marcus Munafo and George Davey Smith


We have previously written about the limited risk posed to pupils, teachers and the community by schools being open during the Covid19 pandemic. Schools have now been open for almost a full academic term (3 months), so it is time to take another look at the evidence.

School re-openings have coincided with an increase in Covid19 infection rates across all UK nations. This rise in infection rates was anticipated, given the annual pattern of rising respiratory infections in the autumn term. There was also a rapid increase in Covid19 testing rates as children returned to school and presented with mild symptoms. Rates of positivity among children were very low at first, but a rise was observed over the autumn. This corresponded with an increase in rates among adults, and there seems to be a strong correlation between Covid19 positivity in schools and rates in the local community.

But has transmission of Covid19 in schools driven the second wave? And should schools be closed again to reduce infection in the community?

This post argues that there is little case for closing schools, as

  • Schools don’t seem to drive transmission in the community
  • The risk of the virus to most school children is very low
  • The harms of school closures are wide ranging.
Photo by CDC on Unsplash

Infection rates among children have been low

Since September children with COVID19 symptoms have been asked to stay at home and have a test before returning to school. Tests equating to 10% of the school pupil population were carried out during first half term in Scotland; only 0.2% of pupils tested positive during this period. Similarly high volumes of testing have been carried out in Wales, but only 0.6% of pupils tested positive between 1st September and 9th December 2020. Pupils made up 3.5% of cases in Wales over that period, despite making up 16% of the population.

However, the weekly Covid19 incidence among 12-16 year olds in Wales was similar to the national average for the week ending 9th December 2020, suggesting a change in the age demographic of cases.

Transmission levels in school have been low

It is unclear what proportion of children who tested positive contracted the infection in school – many children have similar social circles both in and out of school. When infections are found in schools, most schools have only 1 or 2 cases within a 2-week period (unless levels in the local community are high). This suggests low levels of transmission in schools.

Children and adults have different symptoms

Comparisons of rates of infection between children and adults should be treated with caution. Cases are diagnosed using recognised Covid19 symptoms, and are influenced by the volume of testing in the community. Younger children seem to be less likely to have symptoms – around 50% of infected children tend to be completely asymptomatic.  They also may have somewhat different pattern of symptoms to adults – fatigue, gastrointestinal symptoms, and changes in sense of smell or taste, but only rarely a cough. Therefore, studies relying on symptoms in children may be unreliable.

Random testing is the best way to find out level of infection

Surveys show that while young adults had the highest levels of infection in September, secondary school pupils now have the highest rates.

Studies which test individuals at random in the community are more reliable indicators of the levels of infection among children compared to adults. The UK Office of National Statistics (ONS) infection survey has been randomly testing people from the community since early May. It showed that young adults (school year 11 to age 24) had the highest positivity rates in September. This became more pronounced in early October when universities re-opened to students. By the end of October, rates among secondary school pupils were similar to those in young adults, at around 2%. Secondary school pupils now have the highest rates. Covid19 positive rates among primary school children are about half those in secondary school children and have barely changed since the beginning of the academic year.

Infection rates among teachers

There is no evidence that teachers are more at risk of death from COVID19, and infection rates among teachers do not seem higher than other professions.

ONS data from the first wave of the COVID19 epidemic in the UK showed that teachers were not at increased risk of death from the disease compared to other professionals. Based on ONS data, during October those working in the education sector had an antibody positivity rate of 8.1% (95% CI 5.9-10.8) compared with 6.5% (95% CI 5.9-7.3) among those working in other professions. This suggests perhaps slightly higher infection rates, but this is estimated with uncertainty.

Infection positivity rates – also measured by the ONS survey –  from 2nd September to 16th October showed that teachers were no more likely to test positive than other professions, although again there was a lot of uncertainty in these estimates*.  The Swedish Public Health Agency have linked data on Covid19 infection to occupational data and found no increase in infection rates among teachers, although there was some evidence of an increase in infection rates among teaching assistants, school counsellor and  headteachers. However, infection rates may have been inflated relative to other profession if there is  increased testing among asymptomatic people in the education sector.

Photo by Jeswin Thomas on Unsplash

Could infections in schools be driving community infection rates?

The evidence suggests this is unlikely.

Infection rate increases appear to coincide with school openings, but the R-number was increasing in Scotland and England before school openings. Hospital admissions due to Covid19 had also started to rise before this point. In September, positivity rates were initially highest among young adults, not among children of school age, suggesting that perhaps infections among school children were not driving community rates. The ONS data showed infection rates levelling off over October half term, and climbing again among young adults and secondary school children after half term. However, this trend was not as marked in primary school children, and was not observed in adults, even amongst the 35-49 year age group, to which many parents of school aged children belong. Another study of community-based testing – the REACT-1 study – found a greater decrease in infections among younger children compared with older children following the October half term holiday, but again there was a lot of uncertainty in this estimate.

Contact mixing patterns show that people tend to have the most contacts within the same age group, followed by the age group closest to them. Children have more opportunities to pass on the infection to other children and young adults, and are not significantly influencing rates in older adults.

The current R-number in England is currently estimated to be slightly below 1 despite schools being open. This shows that it is possible to drive down infection rates in the community whilst keeping schools open. Furthermore, when everything else but schools are closed – such as in the case of the national lockdown which occurred in England in November, school children will have more contacts than anyone else and schools will contribute to relatively more transmissions in the community even if transmission rates are low overall.

Closing schools is not the answer

Rates have recently fallen among adults in England, despite schools remaining open and secondary school rates increasing. The evidence suggests low levels of virus transmission within schools. First Minister of Wales Mark Drakeford recently said that behavioural evidence suggests closing schools could place some children “in even riskier environments”. Children being looked after by their grandparents rather than being in school would be more dangerous in terms of the virus being transmitted to a higher risk group.

Any public health intervention should consider the costs as well as the benefits. We know that school closures have wide ranging adverse consequences for children and families as outlined by UNESCO, and such costs are particularly pronounced for the poorest and most vulnerable children in society. Children:

  • who do not have access to technology to participate in online learning
  • whose parents who do not have the resources or the educational background to help

have been shown to fall further behind following school closures. Evidence suggests that children’s mental health deteriorated during the first lockdown, and that vulnerable children were at greater risk of violence and exploitation. School closures can also cause economic hardship due to parents being unable to work.  This has prompted Robert Jenkins Global Chief of Education at UNICEF to issue a statement over the last few days saying:

“Evidence shows that schools are not the main drivers of this pandemic. Yet, we are seeing an alarming trend whereby governments are once again closing down schools as a first recourse rather than a last resort. In some cases, this is being done nationwide, rather than community by community, and children are continuing to suffer the devastating impacts on their learning, mental and physical well-being and safety”.

If schools being open are not major drivers of transmission in the community (which they don’t appear to be), given that the risk of the virus to most school children is very low, there is very little case for closing them given the potential harm this could cause.

Footnote: Secondary schools in Wales were closed early for Christmas on the 11th December 2020

*(estimates ranged from 0.2% (95%CI=0.07-0.53) for primary school teachers to 0.5% teachers of unknown type (95% CI=0.36-0.69) compared with 0.4% (95%=0.39-0.49) for all other professions)

We should be cautious about associations of patient characteristics with COVID-19 outcomes that are identified in hospitalised patients.

Gareth J Griffith, Gibran Hemani, Annie Herbert, Giulia Mancano, Tim Morris, Lindsey Pike, Gemma C Sharp, Matt Tudball, Kate Tilling and Jonathan A C Sterne, together with the authors of a preprint on collider bias in COVID-19 studies.

All authors are members of the MRC Integrative Epidemiology Unit at the University of Bristol. Jonathan Sterne is Director of Health Data Research UK South West

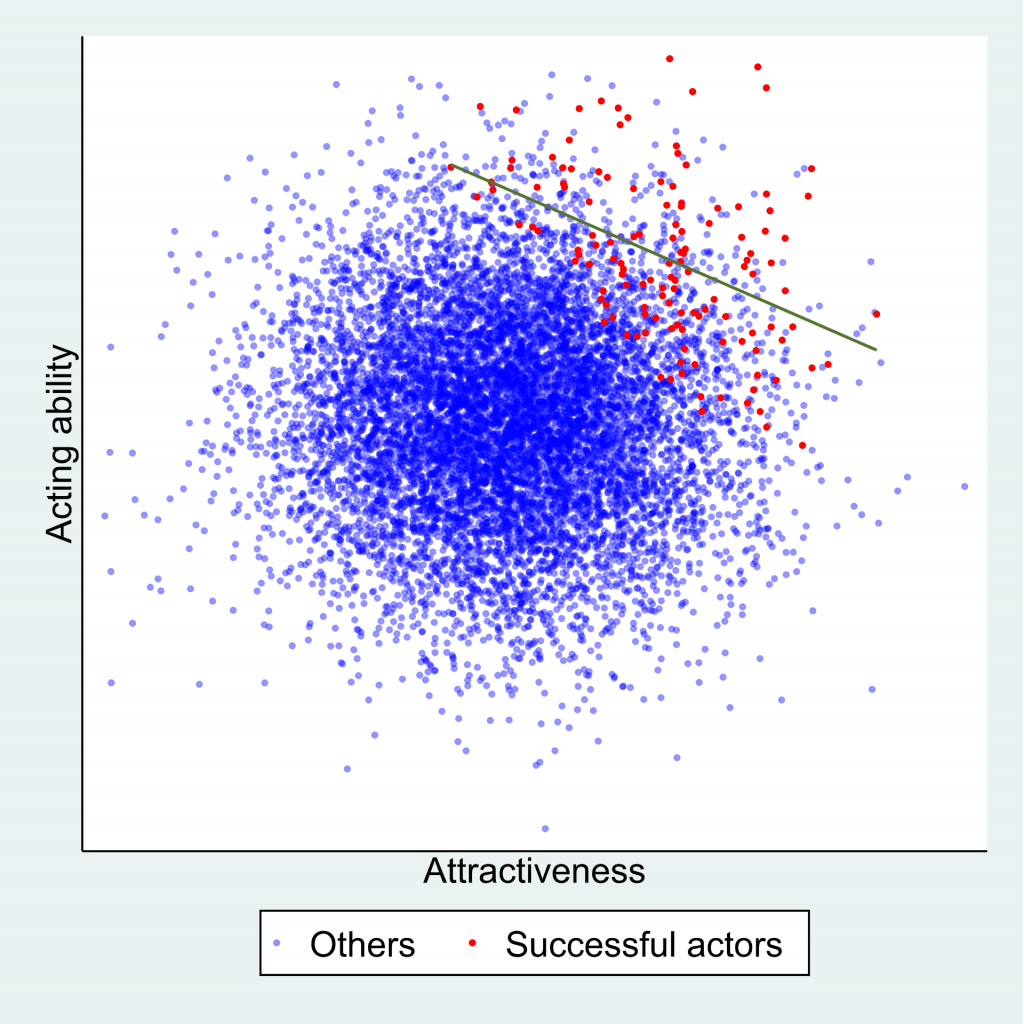
Among successful actors, being physically attractive is inversely related to being a good actor. Among American college students, being academically gifted is inversely related to being good at sport.

Among people who have had a heart attack, smokers have better subsequent health than non-smokers. And among low birthweight infants, those whose mothers smoked during pregnancy are less likely to die than those whose mothers did not smoke.

These relationships are not likely to reflect cause and effect in the general population: smoking during pregnancy does not improve the health of low birthweight infants. Instead, they arise from a phenomenon called ‘selection bias’, or ‘collider bias’.

Understanding selection bias

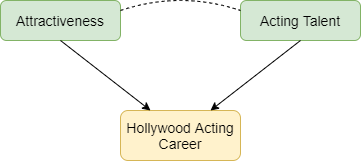
Selection bias occurs when two characteristics influence whether a person is included in a group for which we analyse data. Suppose that two characteristics (for example, physical attractiveness and acting talent) are unrelated in the population but that each causes selection into the group (for example, people who have a successful Hollywood acting career). Among individuals with a successful acting career we will usually find that physical attractiveness will be negatively associated with acting talent: individuals who are more physically attractive will be less talented actors (Figure 1). Selection bias arises if we try to infer a cause-effect relationship between these two characteristics in the selected group. The term ‘collider bias’ refers to the two arrows indicating cause and effect that ‘collide’ at the effect (being a successful actor).

Figure 1: Selection effects exerted on successful Hollywood actors. Green boxes highlight characteristics that influence selection. Yellow boxes indicate the variable selected upon. Arrows indicate causal relationships: the dotted line indicates a non-causal induced relationship that arises because of selection bias.

Figure 2 below explains this phenomenon. Each point represents a hypothetical person, with their level of physical attractiveness plotted against their level of acting talent. In the general population (all data points) an individual’s attractiveness tells us nothing about their acting ability – the two characteristics are unrelated. The red data points represent successful Hollywood actors, who tend to be more physically attractive and to be more talented actors. The blue data points represent other people in the population. Among successful actors the two characteristics are strongly negatively associated (green line), solely because of the selection process. The direction of the bias (whether it is towards a positive or negative association) depends on the direction of the selection processes. If they act in the same direction (both positive or both negative) the bias will usually be towards a negative association. If they act in opposite directions the bias will usually be towards a positive association.

Figure 2:  The effect of sample selection on the relationship between attractiveness and acting talent. The green line depicts the negative association seen in successful actors.


Why is selection bias important for COVID-19 research?

In health research, selection processes may be less well understood, and we are often unable to observe the unselected group. For example, many studies of COVID-19 have been restricted to hospitalised patients, because it was not possible to identify all symptomatic patients, and testing was not widely available in the early phase of the pandemic. Selection bias can seriously distort relationships of risk factors for hospitalisation with COVID-19 outcomes such as requiring invasive ventilation, or mortality.

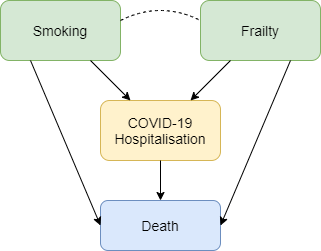
Figure 3 shows how selection bias can distort risk factor associations in hospitalised patients. We want to know the causal effect of smoking on risk of death due to COVID-19, and the data available to us is on patients hospitalised with COVID-19. Associations between all pairs of factors that influence hospitalisation will be distorted in hospitalised patients. For example, if smoking and frailty each make an individual more likely to be hospitalised with COVID-19 (either because they influence infection with SARS-CoV-2 or because they influence COVID-19 disease severity), then their association in hospitalised patients will usually be more negative than in the whole population. Unless we control for all causes of hospitalisation, our estimate of the effect of any individual risk factor on COVID-19 mortality will be biased. For example, it would be unsurprising that within hospitalised patients with COVID-19 we observe that smokers have better health than non-smokers because they are likely to be younger and less frail, and therefore less likely to die after hospitalisation. But that finding may not reflect a protective effect of smoking on COVID-19 mortality in the whole population.

Figure 3: Selection effects on hospitalisation with COVID-19. Box colours are as in Figure 1. Blue boxes represent outcomes. Arrows indicate causal relationships, the dotted line indicates a non-causal induced relationship that arises because of selection bias.


Selection bias may also be a problem in studies based on data from participants who volunteer to download and use COVID-19 symptom reporting apps. People with COVID-19 symptoms are more likely to use the app, and so are people with other characteristics (younger people, people who own a smartphone, and those to whom the app is promoted on social media). Risk factor associations within app users may therefore not generalise to the wider population.

What can be done?

Findings from COVID-19 studies conducted in selected groups should be interpreted with great caution unless selection bias has been explicitly addressed. Two ways to do so are readily available. The preferred approach uses representative data collection for the whole population to weight the sample and adjust for the selection bias.  In absence of data on the whole population, researchers should conduct sensitivity analyses that adjust their findings based on a range of assumptions about the selection effects. A series of resources providing further reading, and tools allowing researchers to investigate plausible selection effects are provided below.

For further information please contact Gareth Griffith (g.griffith@bristol.ac.uk) or Jonathan Sterne (jonathan.sterne@bristol.ac.uk).

Further reading and selection tools:

Dahabreh IJ and Kent DM. Index Event Bias as an Explanation for the Paradoxes of Recurrence Risk Research. JAMA 2011; 305(8): 822-823.

Griffith, Gareth, Tim M. Morris, Matt Tudball, Annie Herbert, Giulia Mancano, Lindsey Pike, Gemma C. Sharp, Jonathan Sterne, Tom M. Palmer, George Davey Smith, Kate Tilling, Luisa Zuccolo, Neil M. Davies, and Gibran Hemani. Collider Bias undermines our understanding of COVID-19 disease risk and severity. Interactive App 2020 http://apps.mrcieu.ac.uk/ascrtain/

Groenwold, RH, Palmer TM and Tilling K. Conditioning on a mediator to adjust for unmeasured confounding OSF Preprint 2020: https://osf.io/vrcuf/

Hernán MA, Hernández-Díaz S and Robins JM. A structural approach to selection bias. Epidemiology 2004; 15: 615-625.

Munafo MR, Tilling K, Taylor AE, Evans DM and Davey Smith G. Collider Scope: When Selection Bias Can Substantially Influence Observed Associations. International Journal of Epidemiology 2018; 47: 226-35.

Luque-Fernandez MA, Schomaker M, Redondo-Sanchez D, Sanchez Perez MJ, Vaidya A and Schnitzer ME. Educational Note: Paradoxical collider effect in the analysis of non-communicable disease epidemiological data: a reproducible illustration and web application International Journal of Epidemiology 2019; 48: 640-653. Interactive App: https://watzilei.com/shiny/collider/

Smith LH and VanderWeele TJ. Bounding bias due to selection. Epidemiology 2019; 30: 509-516. Interactive App: https://selection-bias.herokuapp.com


How can researchers engage with policy?

Dr Alisha Davies

Dr Laura Howe

Prof Debbie Lawlor

Dr Lindsey Pike

Follow Alisha, Laura, Debbie and Lindsey on Twitter

Policy engagement is becoming more of a priority in academic life, as emphasis shifts from focusing purely on academic outputs to creating impact from research. Research impact is defined by UKRI as ‘the demonstrable contribution that excellent research makes to society and the economy’.

On 25 June 2019 the IEU held its first Engagers’ Lunch event, which focused on policy engagement. Joined by Dr Alisha Davies, Head of Research from Public Health Wales, Dr Laura Howe, Professor Debbie Lawlor and Dr Lindsey Pike from the IEU facilitated discussion drawing on their experiences – from both sides of the table – of connecting research and policy. Below we summarise advice from our speakers about engaging with policy.

The benefits of engaging with policy & how to do it

  • As an academic you need to consider what your ‘offer’ is. What expertise do you bring? This may be topic specific knowledge or relate to strong academic skills such as critical approaches to complex challenges, novel methods in evaluation, health economics. Recognise where you add value; the remit of academia is to develop robust evidence in response to complex and challenging questions using reliable methods – a gap that those in practice and /or policy cannot fill alone.
  • Find the right people to engage with – who are the decision makers in your area of research? Listen to what is currently important to inform action / policy. Read through local and national strategies in your topic of expertise to understand the wider landscape and where your work might inform, or where you might be able to address some of those key gaps. Academics can also submit evidence to policy (colleagues from the University of Bristol can access PolicyBristol’s policy scan, which lists current opportunities to engage).
  • Be visible and actively engage. Find out what local events are going on in your area related to your research and go along to meet local public health professionals. It’s a good way to meet people, find commonalities and form collaborations.
  • Condense your new research into a short briefing, identify what it adds to the existing evidence base, how does it inform given the wider context.
  • As an academic you will have a network of other research colleagues. Policymakers value being able to draw on this network for information. When providing evidence, don’t just cite your own – objectivity is one of the key advantages of working with academics, and policymakers value your intellectual independence. Your knowledge of the broader evidence base is invaluable.
  • Setting up a research steering group or stakeholder panel can be a great way to develop your relationships and ensure your research is speaking to policy, practice or industry priorities. Key to this is getting the right people involved – this blog post from Fast Track Impact has some useful advice.

The challenges of engaging with policy & how to navigate them

  • Academic and policymaking timescales are different. Policymakers need an answer yesterday while academics may not feel comfortable with providing a definitive response without time for reflection. There’s a need for flexibility on both sides.
  • There are also tensions between the perceived need for certainty and ability to be able to provide it. Policymakers may want ‘an answer’, but the evidence base may not be robust enough to give one. It is more useful to outline what we do and do not know, with a ‘balance of probabilities’ recommendation, than to say ‘more research is needed’.
  • Language can also be a barrier. Academic language is complex and, at times, impenetrable; policymaker documents need to be aimed at an intelligent lay audience, without jargon, and focusing on what matters to them (outlining policy options and the evidence base behind them – not lengthy discussions of statistical methods). Look at Public Health Wales’ publications, for example on digital technology, adverse childhood experiences and resilience, or mass unemployment events, or examples from the NIHR Dissemination Centre or PolicyBristol to get a sense of the language to use.
  • Do you think you have time for networking with non-academic stakeholders? The perception of opportunity costs can be another barrier for academics. While time for networking might not be costed into your grant funding, think of it in the same way as writing a grant application; you can’t guarantee the outcome but the potential reward is significant.
  • There are no guarantees in policy engagement work, and a level of realism is required around what findings from one study can achieve. Policymaking is a complex and messy process; the evidence base is just one factor in decision making. Your recommendations may not be taken up because of politics, resource issues, or other concerns taking priority. Sometimes your relationships will reach honourable dead ends, where you realise that interests, capacity or timescales are not as aligned as you thought. Knowing this before you start is important to avoid feeling disillusioned.
Cartoon showing complexity of policymaking process and comparing it to making sausages
Policymaking is a complex and messy process; the evidence base is just one factor in decision making. Image from Sausages, evidence and policymaking: The role of universities in a post-truth world, Policy Institute at Kings 2017

In summary, the panel concluded that policymakers are interested in academic research as long as their priorities are addressed. While outcomes are not guaranteed, our colleagues at PolicyBristol advise a strategy of ‘engineered serendipity’ – looking for and capitalising on opportunities, being ready to talk about your research in a clear and policy orientated way (why does your research matter and what are the key recommendations?) and aim to build long term and trusting relationships with policymakers.

If you’d be interested in attending a future Engagers’ Lunch, please contact Lindsey Pike.

Further information & resources

PolicyBristol aims to enhance the influence and impact of research from across the University of Bristol on policy and practice at the local, national and international level.

Public Health Wales Research and Evaluation work collaboratively across Public Health Wales and with external academic and partner organisations, and are keen to facilitate research links across Public Health Wales with new national and international partners.

Research impact at the UK Parliament ‘Everything you need to know to engage with UK Parliament as a researcher’

Parliamentary research services across the legislatures include:

  • House of Commons Library: an independent research and information unit. It provides impartial information for Members of Parliament of all parties and their staff.
  • Parliamentary Office of Science and Technology: Parliament’s in-house source of independent, balanced and accessible analysis of public-policy issues related to science and technology.
  • Research and Information Service (RaISe): aims to meet the information needs of the Northern Ireland Assembly Members, their staff and the secretariat in an impartial, objective, timely and non-partisan manner.
  • Scottish Parliament Information Centre (SPICe): the internal parliamentary research service for Members of the Scottish Parliament.
  • Senedd Research: an expert, impartial and confidential research and information service designed to meet the needs of Wales’ National Assembly Members and their staff.