The manufacturing or importing of packs of cigarettes with fewer than 20 cigarettes per pack was prohibited in the UK when the EU Tobacco Products Directive and standardised packaging legislation were fully implemented in May 2017. This change was aimed at reducing the affordability of cigarettes and thereby discouraging young people from smoking. This directive also required the removal of branding and established a standard shape and dark green colour for packaging, including pictorial health warnings, which prevented the use of packaging for promotion and reduced its appeal.
However, the tobacco industry has been able to exploit loopholes in recent packaging regulations, including the absence of a regulated maximum pack size, by introducing non-standard and larger pack sizes to the market to distinguish products. This is a public health concern given evidence that larger pack sizes are linked to increased smoking, and could undermine existing tobacco control success.
Evidence shows that larger pack sizes are linked to increased smoking.
In a recent Addiction Opinion and Debate paper, we proposed that a cap on cigarette pack size should be introduced; a pragmatic solution would be to permit only a single pack size of 20, which is now the minimum in many countries. This approach would reduce the number of cigarettes in packs in several countries such as Australia – where packs up to sizes of 50 are available – and prevent larger sizes being introduced elsewhere.
Capping cigarette pack size therefore has the potential to both reduce smoking and prevent increased smoking. While the health benefits of reducing smoking alone are small, it may have important indirect effects on health through its role in facilitating quitting. Those smoking fewer cigarettes per day are more likely to attempt to quit and succeed in doing so. Trials of smoking-reduction interventions have also found that these can lead to increased quitting when combined with nicotine replacement therapy.
Our Opinion and Debate paper drew on evidence from a range of sources including industry documents and analyses, population surveys, intervention trials and Mendelian randomization analyses. Together these suggest that consumption increases with larger pack size, and cessation increases with reduced consumption. However, direct experimental evidence is not currently available to determine whether pack size influences the amount of tobacco consumed, or whether the association is due to other factors.
People who want to quit may be using smaller packs as a method of self-control, and smokers who successfully cut down and later quit may be more motivated to do so. Cost is also an important factor and larger packs may be linked to increased smoking because they have a lower cost per cigarette. Further research is needed to determine whether the associations between pack size, smoking and cessation are causal to estimate the impact of policies to cap cigarette pack size.
Commentaries on our Opinion and Debate paper, published in the May 2020 Issue of Addiction highlight the need to understand the mechanisms for the associations observed between pack size and smoking in order to identify the optimal cigarette pack size. Although mandating packs of 20 is a pragmatic approach, pack size regulation needs to achieve a compromise between tobacco affordability and smokers’ self-regulation. Nevertheless, the policy debate should start now to address this neglected aspect of tobacco control.
To find out more visit the Behaviour Change by Design website or follow us on Twitter @BehavChangeDsgn @BristolTARG
Gareth J Griffith, Gibran Hemani, Annie Herbert, Giulia Mancano, Tim Morris, Lindsey Pike, Gemma C Sharp, Matt Tudball, Kate Tilling and Jonathan A C Sterne, together with the authors of a preprint on collider bias in COVID-19 studies.
All authors are members of the MRC Integrative Epidemiology Unit at the University of Bristol. Jonathan Sterne is Director of Health Data Research UK South West
Among successful actors, being physically attractive is inversely related to being a good actor. Among American college students, being academically gifted is inversely related to being good at sport.
Among people who have had a heart attack, smokers have better subsequent health than non-smokers. And among low birthweight infants, those whose mothers smoked during pregnancy are less likely to die than those whose mothers did not smoke.
These relationships are not likely to reflect cause and effect in the general population: smoking during pregnancy does not improve the health of low birthweight infants. Instead, they arise from a phenomenon called ‘selection bias’, or ‘collider bias’.
Understanding selection bias
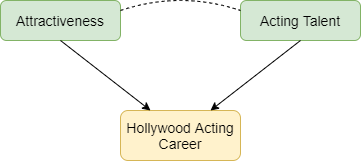
Selection bias occurs when two characteristics influence whether a person is included in a group for which we analyse data. Suppose that two characteristics (for example, physical attractiveness and acting talent) are unrelated in the population but that each causes selection into the group (for example, people who have a successful Hollywood acting career). Among individuals with a successful acting career we will usually find that physical attractiveness will be negatively associated with acting talent: individuals who are more physically attractive will be less talented actors (Figure 1). Selection bias arises if we try to infer a cause-effect relationship between these two characteristics in the selected group. The term ‘collider bias’ refers to the two arrows indicating cause and effect that ‘collide’ at the effect (being a successful actor).
Figure 1: Selection effects exerted on successful Hollywood actors. Green boxes highlight characteristics that influence selection. Yellow boxes indicate the variable selected upon. Arrows indicate causal relationships: the dotted line indicates a non-causal induced relationship that arises because of selection bias.
Figure 2 below explains this phenomenon. Each point represents a hypothetical person, with their level of physical attractiveness plotted against their level of acting talent. In the general population (all data points) an individual’s attractiveness tells us nothing about their acting ability – the two characteristics are unrelated. The red data points represent successful Hollywood actors, who tend to be more physically attractive and to be more talented actors. The blue data points represent other people in the population. Among successful actors the two characteristics are strongly negatively associated (green line), solely because of the selection process. The direction of the bias (whether it is towards a positive or negative association) depends on the direction of the selection processes. If they act in the same direction (both positive or both negative) the bias will usually be towards a negative association. If they act in opposite directions the bias will usually be towards a positive association.
Figure 2: The effect of sample selection on the relationship between attractiveness and acting talent. The green line depicts the negative association seen in successful actors.
Why is selection bias important for COVID-19 research?
In health research, selection processes may be less well understood, and we are often unable to observe the unselected group. For example, many studies of COVID-19 have been restricted to hospitalised patients, because it was not possible to identify all symptomatic patients, and testing was not widely available in the early phase of the pandemic. Selection bias can seriously distort relationships of risk factors for hospitalisation with COVID-19 outcomes such as requiring invasive ventilation, or mortality.
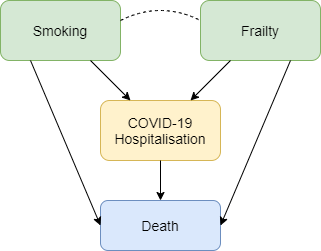
Figure 3 shows how selection bias can distort risk factor associations in hospitalised patients. We want to know the causal effect of smoking on risk of death due to COVID-19, and the data available to us is on patients hospitalised with COVID-19. Associations between all pairs of factors that influence hospitalisation will be distorted in hospitalised patients. For example, if smoking and frailty each make an individual more likely to be hospitalised with COVID-19 (either because they influence infection with SARS-CoV-2 or because they influence COVID-19 disease severity), then their association in hospitalised patients will usually be more negative than in the whole population. Unless we control for all causes of hospitalisation, our estimate of the effect of any individual risk factor on COVID-19 mortality will be biased. For example, it would be unsurprising that within hospitalised patients with COVID-19 we observe that smokers have better health than non-smokers because they are likely to be younger and less frail, and therefore less likely to die after hospitalisation. But that finding may not reflect a protective effect of smoking on COVID-19 mortality in the whole population.
Figure 3: Selection effects on hospitalisation with COVID-19. Box colours are as in Figure 1. Blue boxes represent outcomes. Arrows indicate causal relationships, the dotted line indicates a non-causal induced relationship that arises because of selection bias.
Selection bias may also be a problem in studies based on data from participants who volunteer to download and use COVID-19 symptom reporting apps. People with COVID-19 symptoms are more likely to use the app, and so are people with other characteristics (younger people, people who own a smartphone, and those to whom the app is promoted on social media). Risk factor associations within app users may therefore not generalise to the wider population.
What can be done?
Findings from COVID-19 studies conducted in selected groups should be interpreted with great caution unless selection bias has been explicitly addressed. Two ways to do so are readily available. The preferred approach uses representative data collection for the whole population to weight the sample and adjust for the selection bias. In absence of data on the whole population, researchers should conduct sensitivity analyses that adjust their findings based on a range of assumptions about the selection effects. A series of resources providing further reading, and tools allowing researchers to investigate plausible selection effects are provided below.
Dahabreh IJ and Kent DM. Index Event Bias as an Explanation for the Paradoxes of Recurrence Risk Research. JAMA 2011; 305(8): 822-823.
Griffith, Gareth, Tim M. Morris, Matt Tudball, Annie Herbert, Giulia Mancano, Lindsey Pike, Gemma C. Sharp, Jonathan Sterne, Tom M. Palmer, George Davey Smith, Kate Tilling, Luisa Zuccolo, Neil M. Davies, and Gibran Hemani. Collider Bias undermines our understanding of COVID-19 disease risk and severity.Interactive App 2020 http://apps.mrcieu.ac.uk/ascrtain/
Deborah Lawlor, Professor of Epidemiology, Emma Anderson, MRC Research Fellow, Marcus Munafò, Professor of Experimental Psychology, Mark Gibson, PhD student, Rebecca Richmond, Vice Chancellor’s Research Fellow
Association is not causation – are we fooled (confounded) when we see associations between sleep problems and disease?
Sleep is important for health. Observational studies show that people who report having sleep problems are more likely to be overweight, and have more health problems including heart disease, some cancers and mental health problems.
A major problem with conventional observational studies is that we cannot tell whether these associations are causal; does being overweight cause sleep problems, or do sleep problems cause people to become overweight? Alternatively, factors that influence how we sleep may also influence our health. For example, smoking might cause sleep problems as well as heart disease and so we are fooled (confounded) into thinking sleep problems cause heart disease when it is really all explained by smoking. In the green paper Advancing our Health: Prevention in the 2020s, the UK Government acknowledged that sleep has had little attention in policy, and that causality between sleep and health is likely to run in both directions.
But, how can we determine the direction of causality for sure? And, how do we make sure we are results are not confounded?
Randomly allocated genetic variation
Our genes are randomly allocated to us from our parents when we are conceived. They do not change across our lifespan, and cannot be changed by smoking, overweight or ill health.
Here at the MRC Integrative Epidemiology Unit we have developed a research method called Mendelian randomization, which uses this family-level random allocation of genes to explore causal effects. To find out more about Mendelian randomization take a look at this primer from the Director of the Unit (Prof George Davey Smith).
In the last two years, we and colleagues from the Universities of Manchester, Exeter and Harvard have identified large numbers of genetic variants that relate to different sleep characteristics. These include:
Insomnia symptoms
How long, on average, someone sleeps each night
Chronotype (whether someone is an ‘early bird’ or ‘lark’ and prefers mornings, or a ‘night owl’ and prefers evenings). Chronotype is thought to reflect variation in our body clock (known as circadian rhythms).
We can use these genetic variants in Mendelian randomization studies to get a better understanding of whether sleep characteristics affect health and disease.
What we did
In our initial studies we used Mendelian randomization to explore the effects of sleep duration, insomnia and chronotype on body mass index, coronary heart disease, mental health problems, Alzheimer’s disease, and breast cancer. We analysed whether the genetic traits that are related to sleep characteristics – rather than the sleep characteristics themselves – are associated with the health outcomes. We combined those results with the effect of the genetic variants on sleep traits which allows us to estimate a causal effect. Using genetic variants rather than participants’ reports of their sleep characteristics makes us much more certain that the effects we identify are not due to confounding or reverse causation.
Are you a night owl or a lark?
What we found
Our results show a mixed picture; different sleep characteristics have varying effects on a range of health outcomes.
Breast cancer was not influenced by insomnia, but appeared to increase with longer sleep duration.
None of these classical sleep traits have any influence on Alzheimer’s disease, though we found some suggestive evidence that daytime napping might decreased its risk.
Having better research evidence about the effects of sleep traits on different health outcomes means that we can give better advice to people at risk of specific health problems. For example, developing effective programmes to alleviate insomnia may prevent coronary heart disease and depression in those at risk. It can also help reduce worry about sleep and health, by demonstrating that some associations that have been found in previous studies are not likely to reflect causality.
If you are worried about your own sleep, the NHS has some useful guidance and signposting to further support.
Genome-wide association study identifies genetic loci for self-reported habitual sleep duration supported by accelerometer-derived estimates. Nature Comms. (2019) https://www.nature.com/articles/s41467-019-08917-4
Investigating causal relations between sleep traits and risk of breast cancer in women: mendelian randomisation study. BMJ (2019) https://www.bmj.com/content/365/bmj.l2327
October sees the return of Stoptober, a Public Health England initiative to encourage smokers to quit. Campaigns like this and many others have been effective in reducing smoking in the UK over a number of decades. However, on average, about 15% of the UK’s population still smoke, and this costs the NHS more than £2.5bn each year.
To help address this, the NHS Long Term Plan has identified a range of measures to encourage healthier behaviours, including the need to speed up the introduction of innovative new health interventions based on digital technologies.
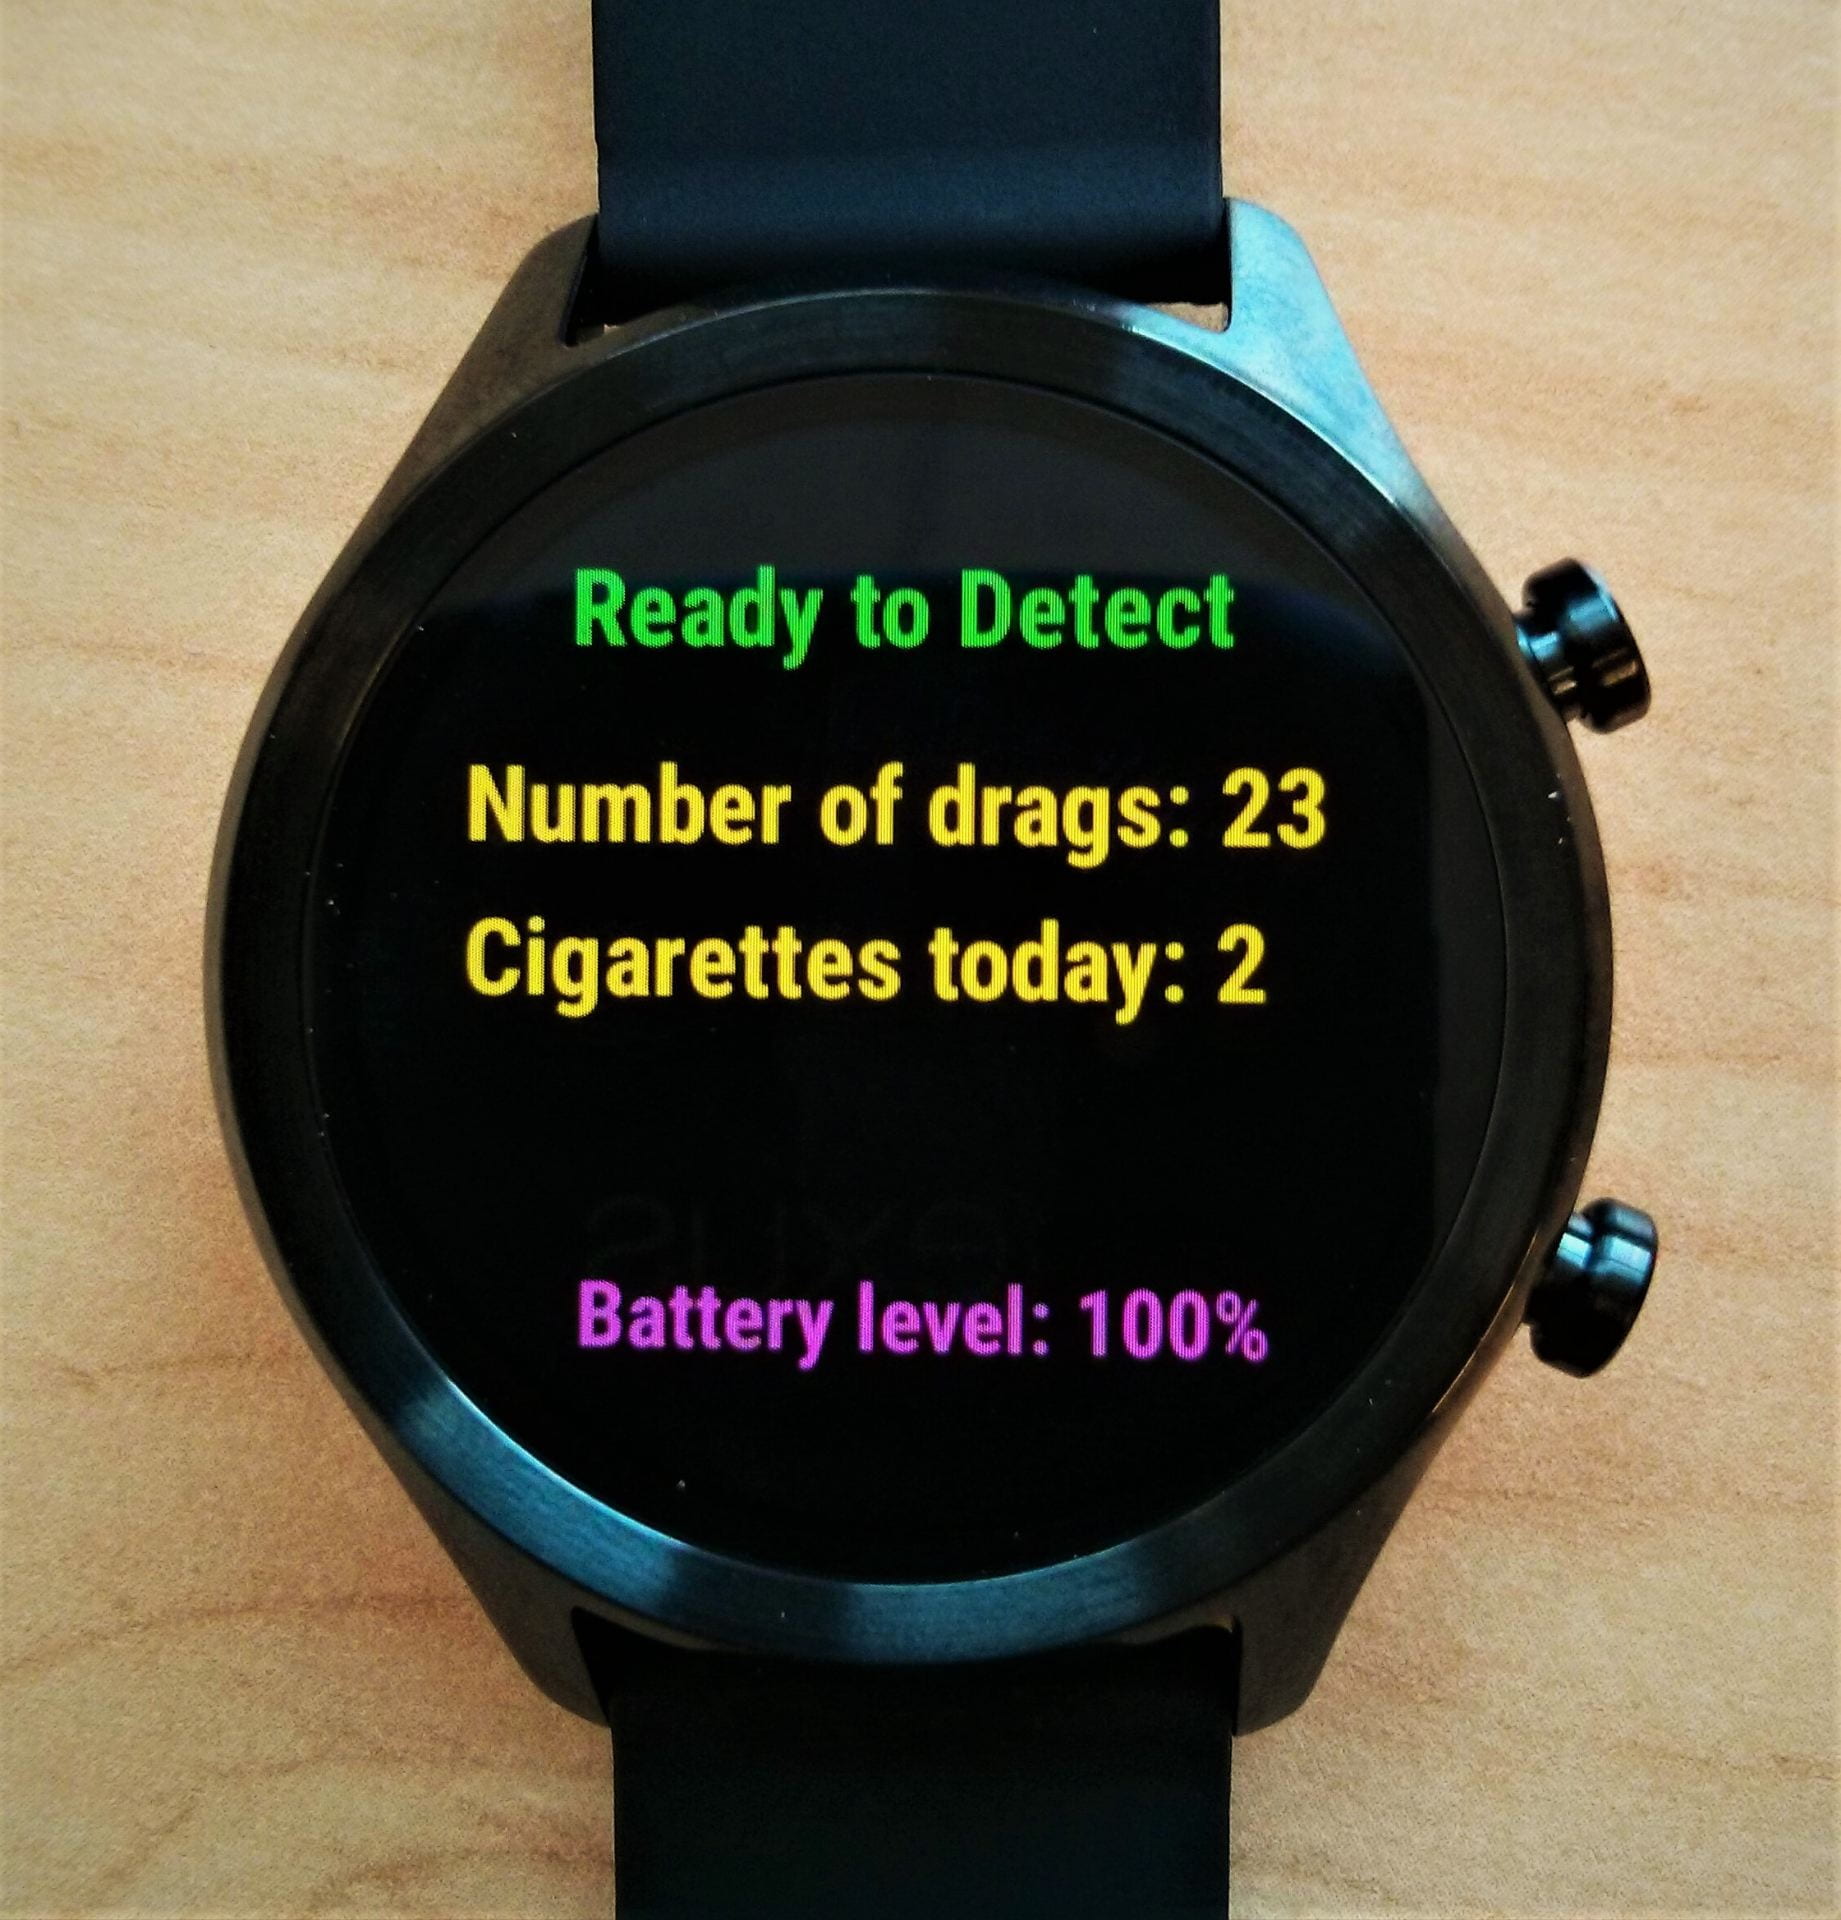
Here in the MRC IEU we’ve been working on a new wearable system that could help people stop smoking; stopWatch is a smartwatch-based system that automatically detects cigarette smoking. Because the system can detect when someone is smoking a cigarette, it can trigger the delivery of interventions to help that person quit smoking at precisely the time the interventions will be most effective.
The stopWatch could help people to stop smoking
What is stopWatch, and how does it work?
stopWatch is an application that runs on a commercially available Android smartwatch. Smartwatches now come equipped with motion sensors, just like the ones in smartphones that measure step counts and activity levels. As smartwatches are attached to the wrist, the motion sensors in a smartwatch can tell us how a person’s hand is moving. stopWatch takes data from the smartwatch’s motion sensors and applies machine learning methods to look for the particular pattern of hand movements that are unique to smoking a cigarette.
How can we use stopWatch to help people quit smoking?
It’s estimated about a third of UK smokers try to stop each year, but only a fifth of those that try manage to succeed. For most smokers an attempt to stop smoking ends with a lapse (having just one cigarette), that can quickly lead to a full relapse to smoking. As stopWatch can detect the exact moment a smoker lapses and has a cigarette, it can trigger the precise delivery of an intervention aimed specifically at helping prevent the lapse turning into a full relapse back to smoking.
Will the intervention work?
A recent article highlighted the potential for using mobile and wearable technologies, like stopWatch, to deliver these kinds of ‘just-in-time’ interventions for smoking. To develop our smoking relapse intervention we will be using the person-based approach, which has an excellent track record of delivering effective health behaviour change interventions. We will also be engaging the highly interdisciplinary cohort of PhD students in the new EPSRC Center for Doctoral Training in Digital Health and care, which brings together students with backgrounds in health, computer science, design and engineering.
However, that same article also pointed out that these types of intervention are still new, and that there has been little formal evaluation of them so far. So we don’t yet know how effective these will be, and it’s important interventions of this kind are subject to a thorough evaluation.
On average, stopWatch detected 71% of cigarettes smoked and of the events stopWatch thought were cigarette smoking, 86% were actually cigarette smoking.
How good is stopWatch at detecting cigarette smoking?
In any system designed to recognise behaviours there is a trade-off between performance and cost/complexity. Other systems that use wearables to detect smoking are available, but these require the wearable be paired with a smartphone and need a data connection to a cloud-based platform in order to work properly. stopWatch is different in that it runs entirely on a smartwatch. It doesn’t need to be paired with a smartphone, and doesn’t need a data connection. This makes it cheaper and simpler than the other systems, but this also means its performance isn’t quite as good.
We recently validated the performance of stopWatch by asking thirteen participants to use stopWatch for a day as they went about their normal lives. On average, stopWatch detected 71% of cigarettes smoked (the system’s sensitivity), and of the events stopWatch thought were cigarette smoking, 86% were actually cigarette smoking (its specificity). This compares with a sensitivity of 82% and specificity of 97% for the systems that require smartphones and data networks.
When will stopWatch and the smoking relapse intervention be available and what will they cost?
The stopWatch system itself is available for research purposes to academic partners now, free of charge. We’re open to discussions with potential commercial partners – please get in touch if you’d like to discuss this (contact details below).
We aim to begin work on the smoking relapse intervention based on stopWatch next year, and we expect development and evaluation to take between 18 and 24 months. The cost of the intervention has yet to be determined. That will depend on many factors, including the partnerships we form to take the intervention forward.
What’s next?
We’re currently putting stopWatch through its paces in some tough testing in occupational settings. This will stress the system so that we can identify any weaknesses, find out to how to improve the system, and develop recommendations for optimising the use of stopWatch in future studies and interventions.
We’re also developing a new smartwatch-based system for the low burden collection of self-report data called ‘dataWatch’. This is currently undergoing feasibility testing in the Children of the 90s study.
There are an estimated 3.2 million e-cigarette users in Great Britain, and the majority of users have switched from smoking to vaping in search of a less harmful alternative to help them quit. In a recent study, people who used e-cigarettes to quit smoking were more likely to be smoke-free after one year compared to people who used more traditional methods such as nicotine patches. So, why are some smokers reluctant to try e-cigarettes, and why have some people been unable to quit smoking using them? The media, researchers, public health officials, and the general public have all played a role in discouraging some smokers from vaping.
E-cigarettes in the media
As a researcher in the field of e-cigarette use, I have often looked at news articles about vaping and felt exasperated. We frequently see e-cigarettes portrayed as a harmful option; according to many news articles, e-cigarettes are dangerous, lead to heart attacks and are as bad for your lungs as cigarettes. The same news outlets often report the opposite finding and say e-cigarettes are actually better for you. This flip-flopping leaves smokers confused and could discourage them from trying e-cigarettes for fear that vaping is actually more harmful than smoking.
Science in the media
So, why do the media keep switching their stance on e-cigarettes? They’re getting their information from the research community, and this community is divided. Some researchers claim that the costs of unknown health risks of vaping and the popularity of e-cigarettes among children and adolescents outweigh the potential benefits of helping smokers to quit, and others claim vice versa.
As researchers, we should be impartial and only provide the public with information which we can back up with evidence from our research, but, as we are still human, our opinions tend to seep through into how we report our findings and even what we choose to research. This lack of agreement in the research community is fuelling the media’s flip-flopping , leading to public confusion and reluctance to try e-cigarettes to help them quit smoking.
Public attitudes to vaping
With all of this contrasting information, it’s no wonder the general public’s opinion of vaping seems to be split too. Negative public opinion can have an impact on whether a smoker wants to try an e-cigarette. Quitting smoking isn’t easy; the last thing smokers want is to feel judged when they are trying to quit.
Negative public attitudes to vaping could put smokers off trying vaping but also affects where they can vape. Many businesses include e-cigarettes in their smoke free policies so that vapers have to stand outside with smokers. When trying to quit, it’s not ideal to be surrounded by the very thing you’re trying to wean yourself off. It’s like being on a diet and spending every meal at an all you can eat buffet when all you can eat is a salad; it’s tempting to slip into old habits. So, despite there being no indoor vaping ban (as there is with cigarettes), vapers are forced outside into a situation where they are more likely to start smoking again.
Unintended consequences of policy
It’s not just organisational policies attempting to control e-cigarette use; in 2016, a legislation called the Tobacco Products Directive (TPD) added a section on e-cigarettes in an attempt to regulate the devices. There were a number of unpopular changes to e-cigarette products as a result. Changes to the amount of nicotine allowed in products and restrictions on innovation of new products may have had unintended consequences.
With the introduction of the TPD, a limit was set on how much nicotine a vape product could contain. Nicotine is the key ingredient in cigarettes which keeps people smoking, and although it is highly addictive, nicotine is not the cigarette ingredient which is likely to kill smokers. E-cigarettes help people to quit smoking because they can contain nicotine which satisfies smokers cravings while exposing them to fewer toxins than smoking would. Limiting the amount of nicotine in these products means that heavier smokers don’t receive enough nicotine from an e-cigarette to satisfy their nicotine addiction and this makes them more likely to start smoking again.
The TPD also requires companies to register products in advance of bringing them to market. Where the e-cigarette industry was creating new, more effective devices at a very fast pace, users now can’t buy these products for a substantial amount of time after they have been developed. This restriction on innovation means that while consumers are waiting for these better products to become available, they could be trying products that don’t meet their needs. I often hear tales of “I tried one once and it was just like puffing air, so I kept smoking instead”. They have tried one product, it wasn’t good enough, and they assume all other products will be just as bad. By restricting innovation, we limit the amount of better-quality devices on the market and increase the likelihood that a smoker looking to quit will come across a poor device and turn back to smoking.
Making it easy to stop smoking
Many smokers want to quit and we, as researchers, media representatives, public health officials and even members of the public, need to make it as easy as possible for them to do so. We need to be clearer in the information we provide, be more accepting of vaping and not limit products which could help the most addicted smokers. I still have hope that smoking will be stubbed out in my generation, and that e-cigarettes could be the disruptive technology needed to help us achieve this.
Heart disease remains the leading cause of death globally, causing over 17.5 million deaths annually. Whilst death rates from heart disease are decreasing in high income countries, the most socioeconomically deprived individuals remain at the greatest risk of developing heart disease. Socioeconomic causes and the wider determinants of health (including living and working conditions, health care services, housing and a number of other wider factors) and are suggested to be the most important driver of health. Behavioural and lifestyle factors, such as smoking, alcohol consumption, diet and exercise, are the second most important contributor to health and disease.
Why does education matter?
Staying in school for longer has been shown to lead to better lifelong health, including reducing the risk of heart disease (cardiovascular disease) and dementia. We also know that those who stay in school are more likely to adopt healthy behaviours. For example, they are less likely to smoke, but more likely to eat a healthy diet and take part in physical activity. These factors, can in turn, reduce the risk of heart disease, such as by reducing body mass index (BMI) or blood pressure. We wanted to understand if these risk factors (BMI, systolic blood pressure and lifetime smoking behaviour) could explain why those who stay in school for longer are less likely to get heart disease, and how much of this effect they explained.
What did we find?
We found that individually, BMI, systolic blood pressure and smoking behaviour explained up to 18%, 27% and 34% of the effect of education on heart disease respectively. When we looked at all three risk factors together, they explain around 40% of the effect. This means that up to 40% of the effect of staying in school reducing the risk of heart disease can be explained by the fact that those who stay in school tend to lead healthier lives. In this work we looked at four outcomes, coronary heart disease (gradual build-up of fatty deposits in arteries), stroke, myocardial infarction (heart attack) and all subtypes of heart disease combined. For all the outcomes we looked at, we found similar results. Notably, the 40% combined effect is smaller than the amount estimated simply from summing the individual effects together. This suggests there is overlap between the three risk factors in how they cause heart disease.
How did we do this?
In our work, we used a few different methods and data sources to answer our questions.
We started by looking at observational data (that is the data self-reported by the participants of the study) in UK Biobank – a large population cohort study of around 500 000 individuals. Of these, almost 220 000 people were eligible to be in our analysis.
We looked at how their education affected their risk of four types of heart disease. We then looked at how the intermediate factors, BMI, blood pressure and smoking, could help explain these results.
Secondly, we replicated these analyses using two types of Mendelian randomisation analyses (a form of genetic instrumental variable analysis, see below), firstly in the UK Biobank group and secondly by using summary data from other studies in the area.
Why use genetic data?
Typically, epidemiologists collect data by asking people to report their behaviours, lifestyle characteristics and any diagnoses from a doctor. Alternatively, people in a study may have been to a clinic where their BMI or blood pressure is measured. However, this type of data can lead to inaccuracies in analyses. This could be because:
measures are not reported (or measured) accurately. For example, it can be difficult to get an accurate measure of blood pressure, where it changes throughout the day, and even just going to a clinic can result in higher blood pressure.
there may be other variables associated with both the exposure and outcome (confounding). One example of this is suggesting that grey hair causes cancer. Really, age is responsible for i) leading to grey hair and ii) leading to cancer. Without accounting for age, we might suggest a false association exists (see figure 1). In our study using education, this could be ethnicity for example, where it influences both staying in school and risk of heart disease.
or an individual with ill health may have been advised to change their lifestyle (reverse causality). For example, an individual with a high BMI may have had a heart attack and have been advised by their doctor to lose weight to avoid having a second heart attack.
Figure 1: Does grey hair really cause cancer?
One way to overcome these limitations is to use Mendelian randomisation. This method uses the genetic variation in an individual’s DNA to help understand causal relationships. Every individual has their own unique genetic make-up, which is determined, and fixed, at the point of conception.
We are interested in single changes to the DNA sequence, called single nucleotide polymorphisms (or SNPs). For all of our risk factors of interest (education, BMI, blood pressure and smoking) there are a number of SNPs that contribute towards the observed measures, that are not influenced by factors later in life. This means, Mendelian randomisation estimates are unlikely to be affected by bias such as confounding, reverse causality or measurement error, as we might expect when we rely on observational data. By using these genetic variants, we can improve our understanding of if, or how, a risk factor truly causes an outcome, or whether it might be spurious.
What else might be important?
Although we find BMI, blood pressure and smoking behaviour explain a very large amount of the effect, over 50% of the effect of education on heart disease is still unknown. In some small sensitivity analyses we looked at the role of diet and exercise as intermediate risk factors; however, these risk factors did not contribute anything beyond the three main risk factors we looked at. Other social factors may be involved. For example, education is linked to higher income and lower levels of workplace stress, but these factors may also be related to those we’ve looked at in this analysis.
One further suggestion for what may be responsible is medication prescribing and subsequent adherence (or compliance). For example, individuals with higher education may be more likely to be prescribed statins (cholesterol lowering drugs) compared to someone who left school earlier, but with the same requirement for medication. Subsequently, of those who are prescribed statins for example, perhaps those with higher education are more likely to take them every day, or as prescribed. We have work ongoing to see whether these factors play a role.
What does this mean for policy?
Past policies that increase the duration of compulsory education have improved health and such endeavours must continue. However, intervening directly in education is difficult to achieve without social and political reforms.
Although we did not directly look at the impact of interventions in this area, our work suggests that by intervening on these three risk factors, we could reduce the number of cases of heart disease attributable to lower levels of education. Public health policy typically aims to improve health by preventing disease across the population. However, perhaps a targeted approach is required to reduce the greatest burden of disease.
In order to achieve maximum reductions in heart disease we now need to i) identify what other intermediate factors may be involved and ii) work to understand how effective interventions could be designed to reduce levels of BMI, blood pressure and smoking in those who leave school earlier. Additionally, our work looked at predominantly European populations, therefore replicating analyses on diverse populations will be important to fully understand the population impact.
We hope this work provides a starting point for considering how we could reduce the burden of heart disease in those most at risk, and work to reduce health inequalities.
 Written by Anna Blackwell, Senior Research Associate