The manufacturing or importing of packs of cigarettes with fewer than 20 cigarettes per pack was prohibited in the UK when the EU Tobacco Products Directive and standardised packaging legislation were fully implemented in May 2017. This change was aimed at reducing the affordability of cigarettes and thereby discouraging young people from smoking. This directive also required the removal of branding and established a standard shape and dark green colour for packaging, including pictorial health warnings, which prevented the use of packaging for promotion and reduced its appeal.
However, the tobacco industry has been able to exploit loopholes in recent packaging regulations, including the absence of a regulated maximum pack size, by introducing non-standard and larger pack sizes to the market to distinguish products. This is a public health concern given evidence that larger pack sizes are linked to increased smoking, and could undermine existing tobacco control success.
Evidence shows that larger pack sizes are linked to increased smoking.
In a recent Addiction Opinion and Debate paper, we proposed that a cap on cigarette pack size should be introduced; a pragmatic solution would be to permit only a single pack size of 20, which is now the minimum in many countries. This approach would reduce the number of cigarettes in packs in several countries such as Australia – where packs up to sizes of 50 are available – and prevent larger sizes being introduced elsewhere.
Capping cigarette pack size therefore has the potential to both reduce smoking and prevent increased smoking. While the health benefits of reducing smoking alone are small, it may have important indirect effects on health through its role in facilitating quitting. Those smoking fewer cigarettes per day are more likely to attempt to quit and succeed in doing so. Trials of smoking-reduction interventions have also found that these can lead to increased quitting when combined with nicotine replacement therapy.
Our Opinion and Debate paper drew on evidence from a range of sources including industry documents and analyses, population surveys, intervention trials and Mendelian randomization analyses. Together these suggest that consumption increases with larger pack size, and cessation increases with reduced consumption. However, direct experimental evidence is not currently available to determine whether pack size influences the amount of tobacco consumed, or whether the association is due to other factors.
People who want to quit may be using smaller packs as a method of self-control, and smokers who successfully cut down and later quit may be more motivated to do so. Cost is also an important factor and larger packs may be linked to increased smoking because they have a lower cost per cigarette. Further research is needed to determine whether the associations between pack size, smoking and cessation are causal to estimate the impact of policies to cap cigarette pack size.
Commentaries on our Opinion and Debate paper, published in the May 2020 Issue of Addiction highlight the need to understand the mechanisms for the associations observed between pack size and smoking in order to identify the optimal cigarette pack size. Although mandating packs of 20 is a pragmatic approach, pack size regulation needs to achieve a compromise between tobacco affordability and smokers’ self-regulation. Nevertheless, the policy debate should start now to address this neglected aspect of tobacco control.
To find out more visit the Behaviour Change by Design website or follow us on Twitter @BehavChangeDsgn @BristolTARG
Gareth J Griffith, Gibran Hemani, Annie Herbert, Giulia Mancano, Tim Morris, Lindsey Pike, Gemma C Sharp, Matt Tudball, Kate Tilling and Jonathan A C Sterne, together with the authors of a preprint on collider bias in COVID-19 studies.
All authors are members of the MRC Integrative Epidemiology Unit at the University of Bristol. Jonathan Sterne is Director of Health Data Research UK South West
Among successful actors, being physically attractive is inversely related to being a good actor. Among American college students, being academically gifted is inversely related to being good at sport.
Among people who have had a heart attack, smokers have better subsequent health than non-smokers. And among low birthweight infants, those whose mothers smoked during pregnancy are less likely to die than those whose mothers did not smoke.
These relationships are not likely to reflect cause and effect in the general population: smoking during pregnancy does not improve the health of low birthweight infants. Instead, they arise from a phenomenon called ‘selection bias’, or ‘collider bias’.
Understanding selection bias
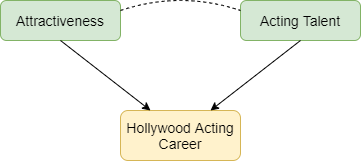
Selection bias occurs when two characteristics influence whether a person is included in a group for which we analyse data. Suppose that two characteristics (for example, physical attractiveness and acting talent) are unrelated in the population but that each causes selection into the group (for example, people who have a successful Hollywood acting career). Among individuals with a successful acting career we will usually find that physical attractiveness will be negatively associated with acting talent: individuals who are more physically attractive will be less talented actors (Figure 1). Selection bias arises if we try to infer a cause-effect relationship between these two characteristics in the selected group. The term ‘collider bias’ refers to the two arrows indicating cause and effect that ‘collide’ at the effect (being a successful actor).
Figure 1: Selection effects exerted on successful Hollywood actors. Green boxes highlight characteristics that influence selection. Yellow boxes indicate the variable selected upon. Arrows indicate causal relationships: the dotted line indicates a non-causal induced relationship that arises because of selection bias.
Figure 2 below explains this phenomenon. Each point represents a hypothetical person, with their level of physical attractiveness plotted against their level of acting talent. In the general population (all data points) an individual’s attractiveness tells us nothing about their acting ability – the two characteristics are unrelated. The red data points represent successful Hollywood actors, who tend to be more physically attractive and to be more talented actors. The blue data points represent other people in the population. Among successful actors the two characteristics are strongly negatively associated (green line), solely because of the selection process. The direction of the bias (whether it is towards a positive or negative association) depends on the direction of the selection processes. If they act in the same direction (both positive or both negative) the bias will usually be towards a negative association. If they act in opposite directions the bias will usually be towards a positive association.
Figure 2: The effect of sample selection on the relationship between attractiveness and acting talent. The green line depicts the negative association seen in successful actors.
Why is selection bias important for COVID-19 research?
In health research, selection processes may be less well understood, and we are often unable to observe the unselected group. For example, many studies of COVID-19 have been restricted to hospitalised patients, because it was not possible to identify all symptomatic patients, and testing was not widely available in the early phase of the pandemic. Selection bias can seriously distort relationships of risk factors for hospitalisation with COVID-19 outcomes such as requiring invasive ventilation, or mortality.
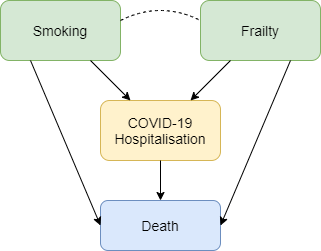
Figure 3 shows how selection bias can distort risk factor associations in hospitalised patients. We want to know the causal effect of smoking on risk of death due to COVID-19, and the data available to us is on patients hospitalised with COVID-19. Associations between all pairs of factors that influence hospitalisation will be distorted in hospitalised patients. For example, if smoking and frailty each make an individual more likely to be hospitalised with COVID-19 (either because they influence infection with SARS-CoV-2 or because they influence COVID-19 disease severity), then their association in hospitalised patients will usually be more negative than in the whole population. Unless we control for all causes of hospitalisation, our estimate of the effect of any individual risk factor on COVID-19 mortality will be biased. For example, it would be unsurprising that within hospitalised patients with COVID-19 we observe that smokers have better health than non-smokers because they are likely to be younger and less frail, and therefore less likely to die after hospitalisation. But that finding may not reflect a protective effect of smoking on COVID-19 mortality in the whole population.
Figure 3: Selection effects on hospitalisation with COVID-19. Box colours are as in Figure 1. Blue boxes represent outcomes. Arrows indicate causal relationships, the dotted line indicates a non-causal induced relationship that arises because of selection bias.
Selection bias may also be a problem in studies based on data from participants who volunteer to download and use COVID-19 symptom reporting apps. People with COVID-19 symptoms are more likely to use the app, and so are people with other characteristics (younger people, people who own a smartphone, and those to whom the app is promoted on social media). Risk factor associations within app users may therefore not generalise to the wider population.
What can be done?
Findings from COVID-19 studies conducted in selected groups should be interpreted with great caution unless selection bias has been explicitly addressed. Two ways to do so are readily available. The preferred approach uses representative data collection for the whole population to weight the sample and adjust for the selection bias. In absence of data on the whole population, researchers should conduct sensitivity analyses that adjust their findings based on a range of assumptions about the selection effects. A series of resources providing further reading, and tools allowing researchers to investigate plausible selection effects are provided below.
Dahabreh IJ and Kent DM. Index Event Bias as an Explanation for the Paradoxes of Recurrence Risk Research. JAMA 2011; 305(8): 822-823.
Griffith, Gareth, Tim M. Morris, Matt Tudball, Annie Herbert, Giulia Mancano, Lindsey Pike, Gemma C. Sharp, Jonathan Sterne, Tom M. Palmer, George Davey Smith, Kate Tilling, Luisa Zuccolo, Neil M. Davies, and Gibran Hemani. Collider Bias undermines our understanding of COVID-19 disease risk and severity.Interactive App 2020 http://apps.mrcieu.ac.uk/ascrtain/
Since the pandemic started, communities have been mobilising to help each other; from shopping for elderly neighbours, to offering to offering a friendly face or other support. Mutual aid networks have sprung up all over the country, and neighbours who hadn’t previously spoken have been introduced to each other via street–level WhatsApp groups. But the degree to which offers of help are matching up with the need for help has been unknown, and this poses a problem for organisations who need to make decisions about where they should target limited resources.
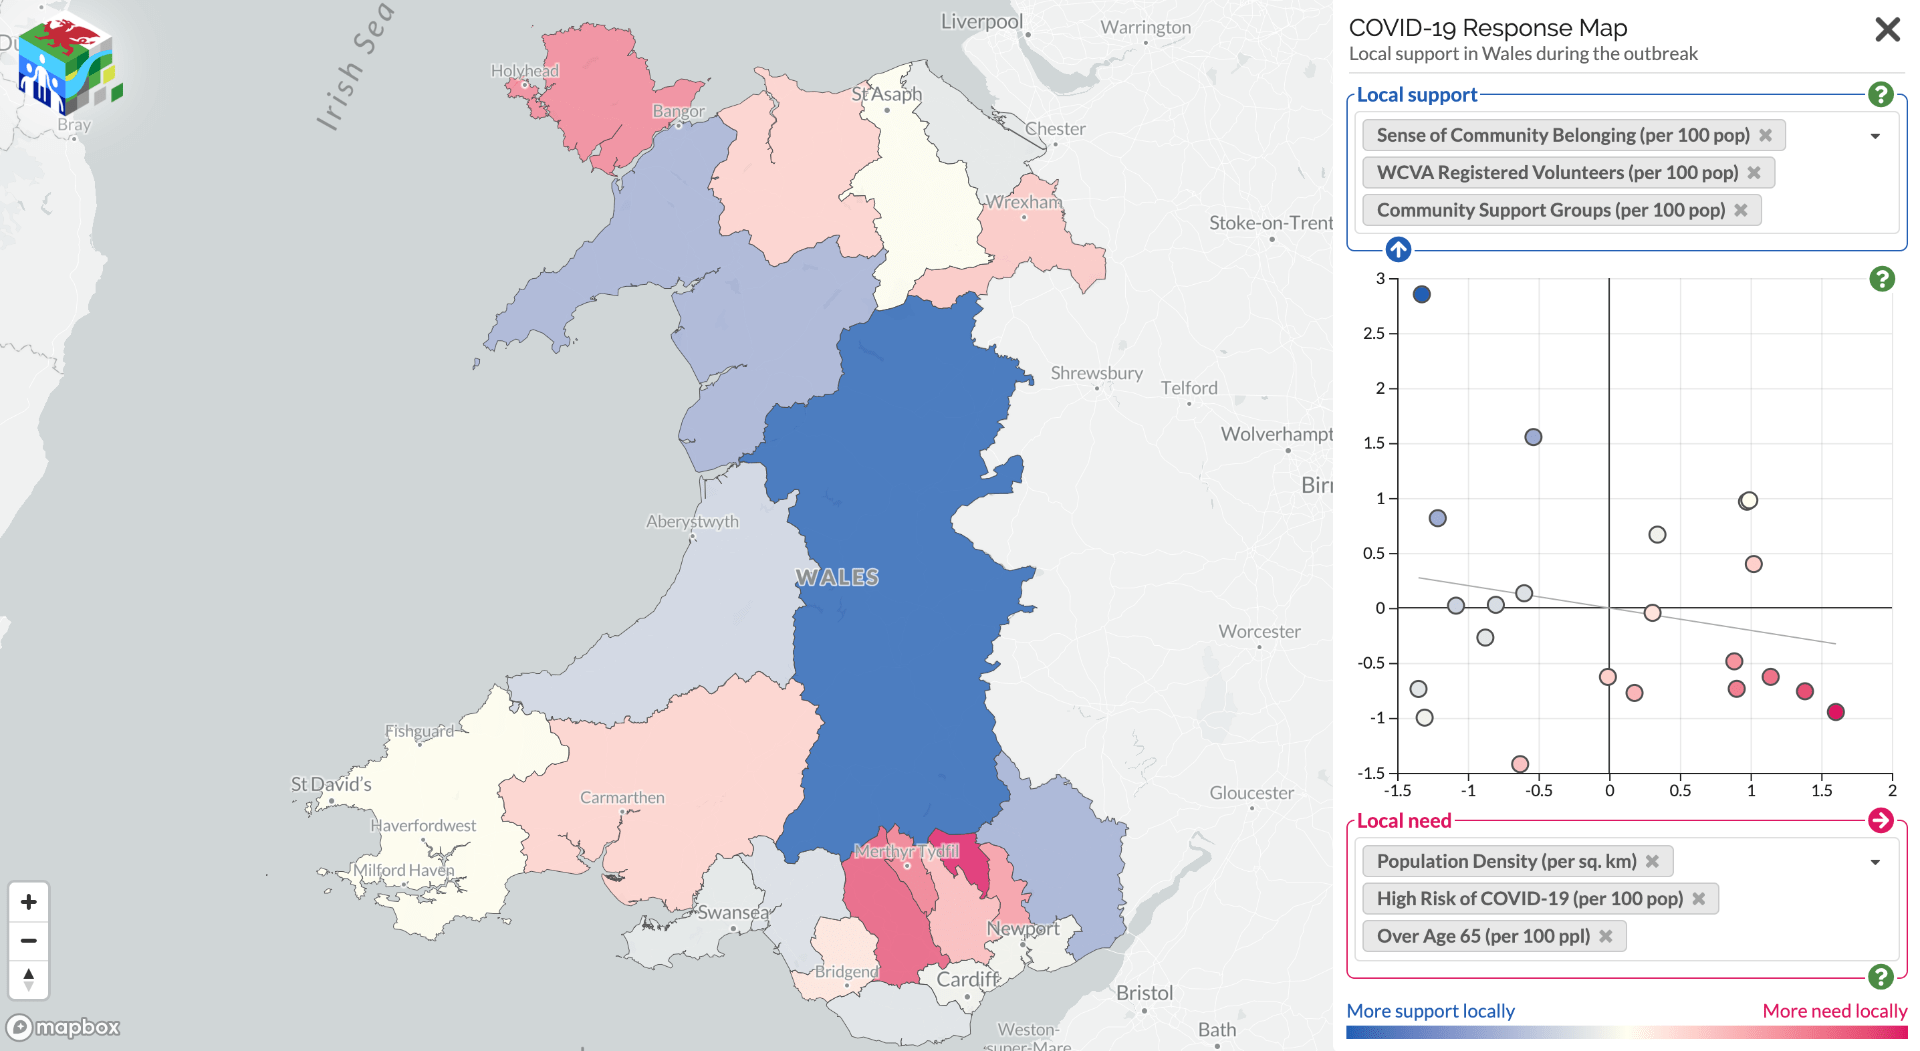
Community support can offer a protective factor against adverse events. Some areas are more vulnerable than others, but knowing which areas are most likely to have a mismatch between support needed and support offered is difficult. To address this issue, a collaboration between the Public Health Wales Research & Evaluation Division and the Dynamic Genetics lab, part of the MRC Integrative Epidemiology Unit at the University of Bristol and supported by the Alan Turing Institute, has mapped these support offers and needs.
Using data from Wales Council for Voluntary Action, COVID-19 Mutual Aid, Welsh Government Statistics and Research, the Office for National Statistics, and social media the project team have created alive map that highlights the areas where further support for communities may be needed. It shows data on support factors, such as number of registered volunteers and population density, against risks, such as demographics, levels of deprivation, and internet access. It aims to inform the responses of national and local government, as well as support providers in Wales.
The site also provides the links to local community groups identified helping to raise awareness of the support available locally.
This map is part of an effort to better understand which communities have better community cohesion and organisation. We are keen to find out your views on how this can be more useful, or other community mobilisation data sources which could be included. Please contact Oliver or Nina with your comments:
If you are a community group and want to be included, please register your group with Covid-19 Mutual Aid (https://covidmutualaid.org/).
The code used to create the map has been released openly on GitHub (https://github.com/DynamicGenetics/COVID-19-Community-Response) so that it can be reproduced. Full information on the sources of data on vulnerability and community support are documented on the Open Science Framework (https://osf.io/c48hw/) and the map will be updated as new information becomes available.
 Written by Anna Blackwell, Senior Research Associate