Written by Marina Vabistsevits and Oliver Lloyd, researchers on PhD studentships linked to the “Data Mining Epidemiological Relationships” programme at the MRC IEU.
Follow us on twitter – @marina_vab, @PlotThiggins
Leaving the EU presents many unique challenges to Britain, among which is the crucial task of maintaining our high levels of food safety. As a submission to the Jean Golding Institute’s data visualisation competition, we briefly investigated the impacts that Brexit may have on British food supplies. The dataset used in this analysis was made available by the Food Standards Agency (FSA) as the focus of the competition, and all code used is freely available in our github repository.
The Need for Information Recompense
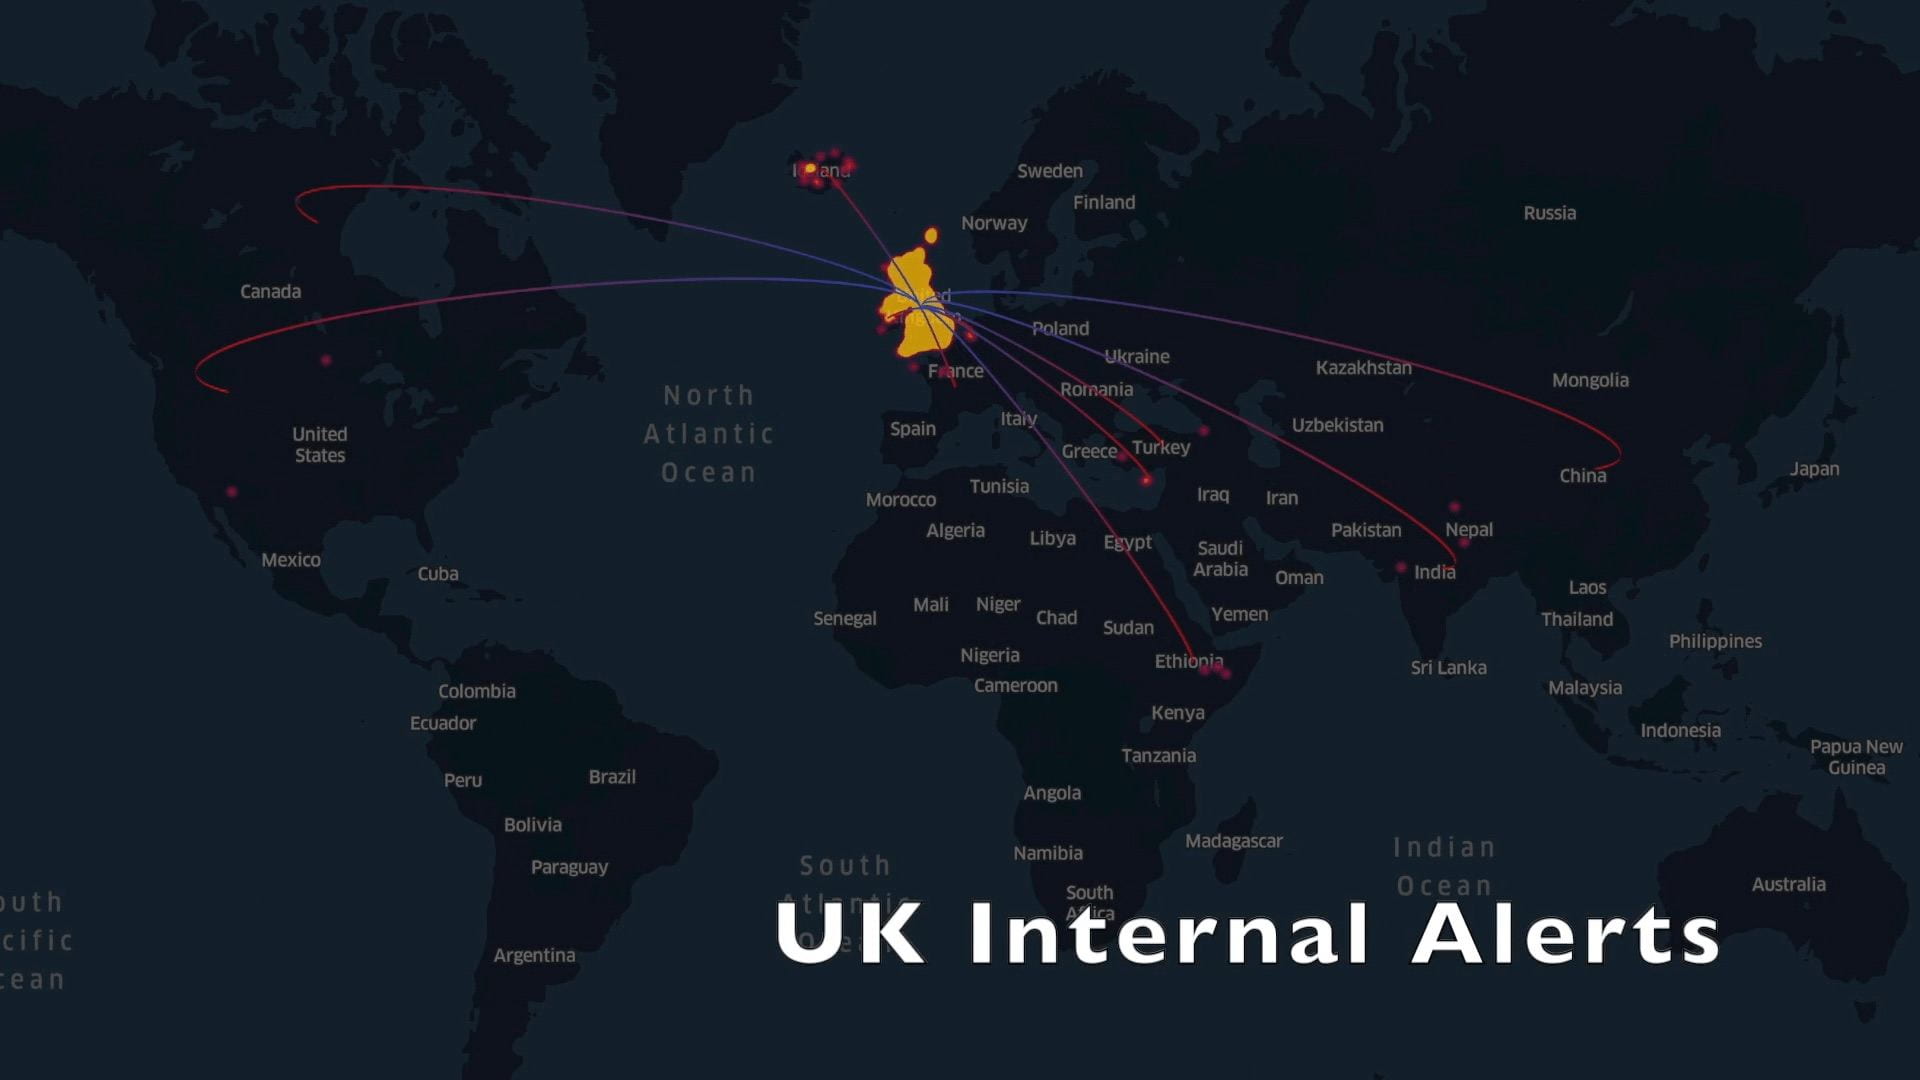
In the first part of the analysis, we explored cases where food imported to Britain led to an alert being raised. The two biggest sources for such alerts were Britain’s internal alert systems (largely the FSA), and the EU’s Rapid Alert System for Food and Feed (RASFF).
Since Britain is on course to lose access to RASFF-supplied information once Brexit is finalised in early 2021, we created the visualisation below as a comparison of the FSA and the RASFF in terms of both the number of alerts raised and the corresponding food’s origin country for each alert.
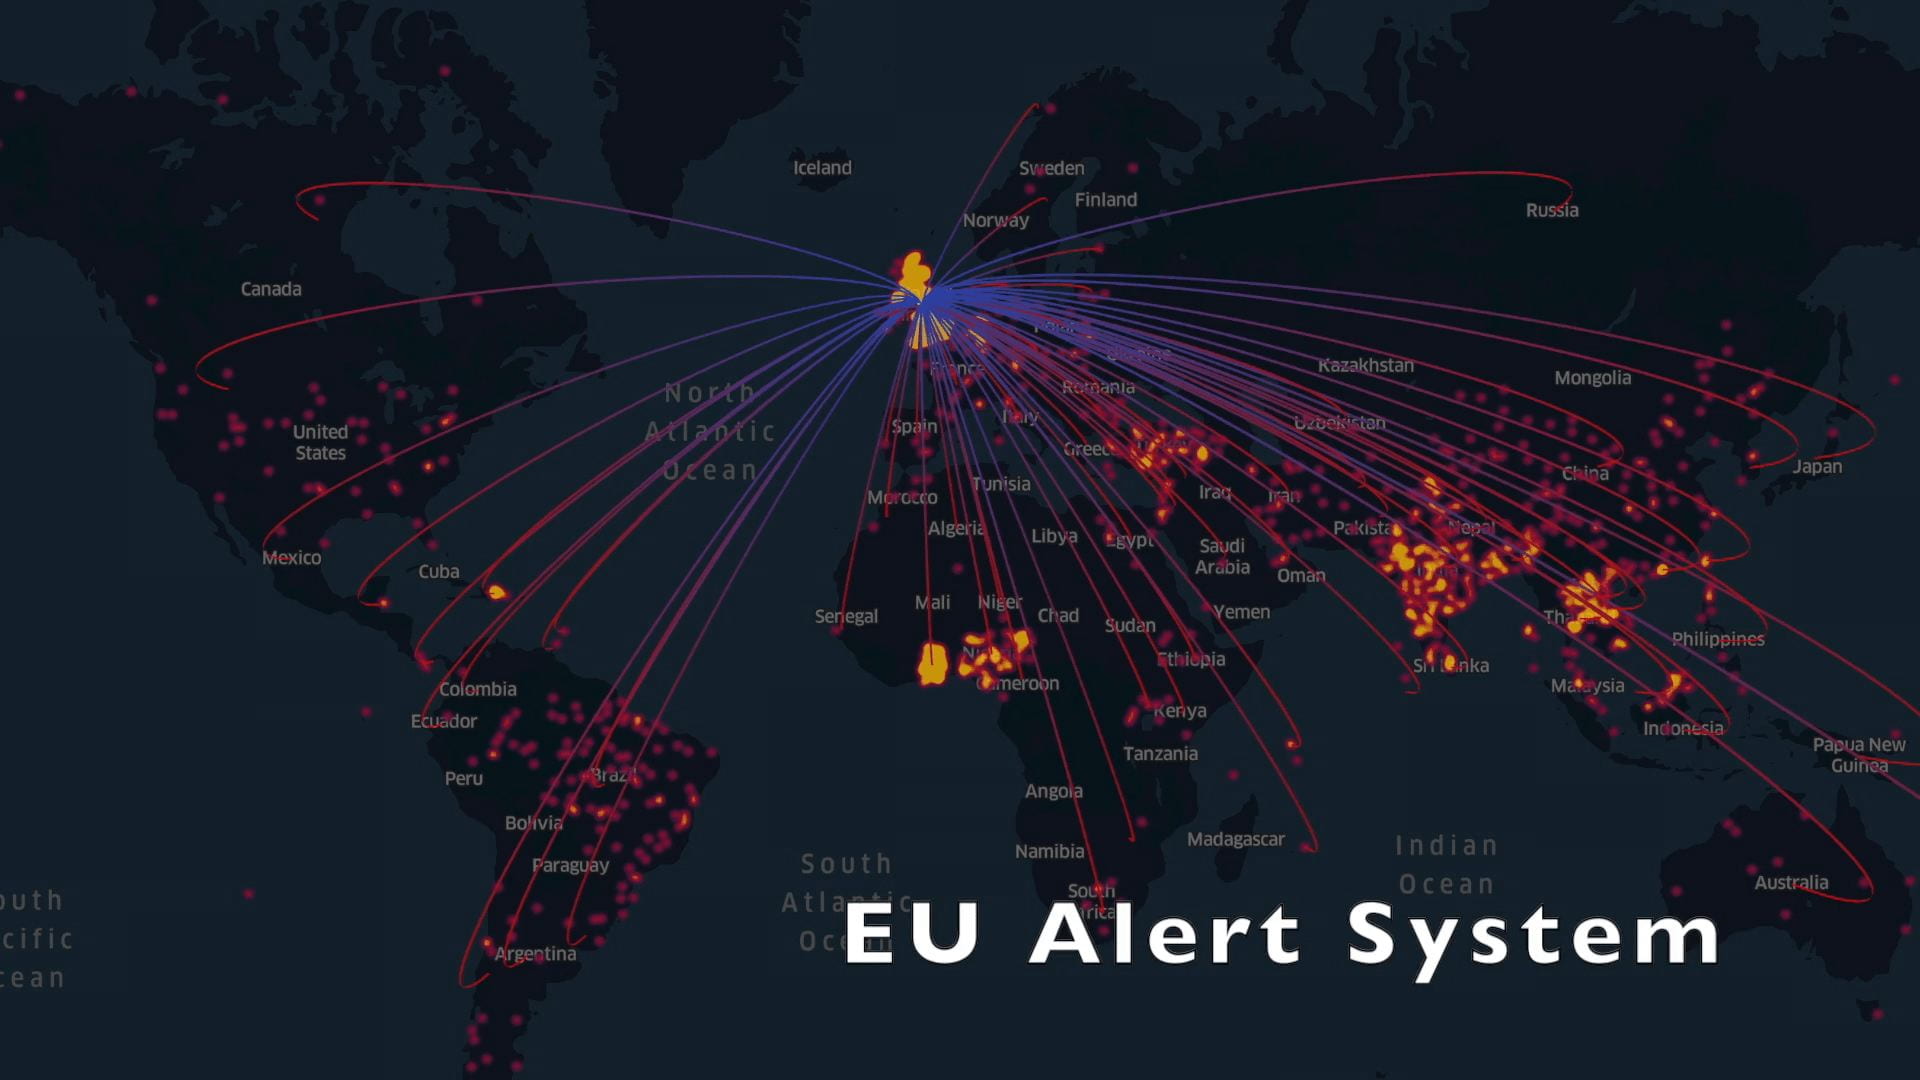
The arcs show the countries of origin of imports that raised alerts, and the yellow-red density map shows the recorded hazard alert frequency from those origins. Interactive versions of the two map instances can be found by following these links: RASFF, UK internal alerts.
If the UK does indeed lose access to the RASFF, the loss of food hazards information about our own imports will be tremendous. The burden then falls on the FSA to develop and extend their alert system (which currently focuses very little on internationally supplied food) to bridge this information gap and ensure food safety for globally imported goods. As of the time of writing we are unsure what steps are being taken by the FSA, or the government at large, to address this issue.
Post-Brexit Shifts in Food Hazard Threats
As an extension of this work, we turned our attention to tariffs and the effect they might have on whom Britain chooses to import from. Upon leaving the EU the UK will have to negotiate new trade deals with both EU and non-EU countries. Since the cost for EU-produced food is expected to rise for Britain after Brexit, we may indeed see Britain importing more from outside of the union, which would naturally bring a shift to the make–up of food hazards that our alert systems will need to detect. Anticipating this shift will allow us to better mitigate the accompanying risk if it does begin to materialise.
To this end, we explored the differences in food hazard threats posed by EU vs non-EU suppliers of Britain’s largest class of imported food: fruits and vegetables. The plot below shows the relative change in frequency for each category of food hazard in the case that Britain switched from 100% EU imports of fruit and vegetables to 100% non-EU. The hazard categories that are likely to increase in non-EU imports are highlighted in red. Please note that this is the most extreme case possible and is unlikely to unfold to this extent in reality– this plot is therefore presented as a guide to the different food threats posed by EU vs non-EU imports.
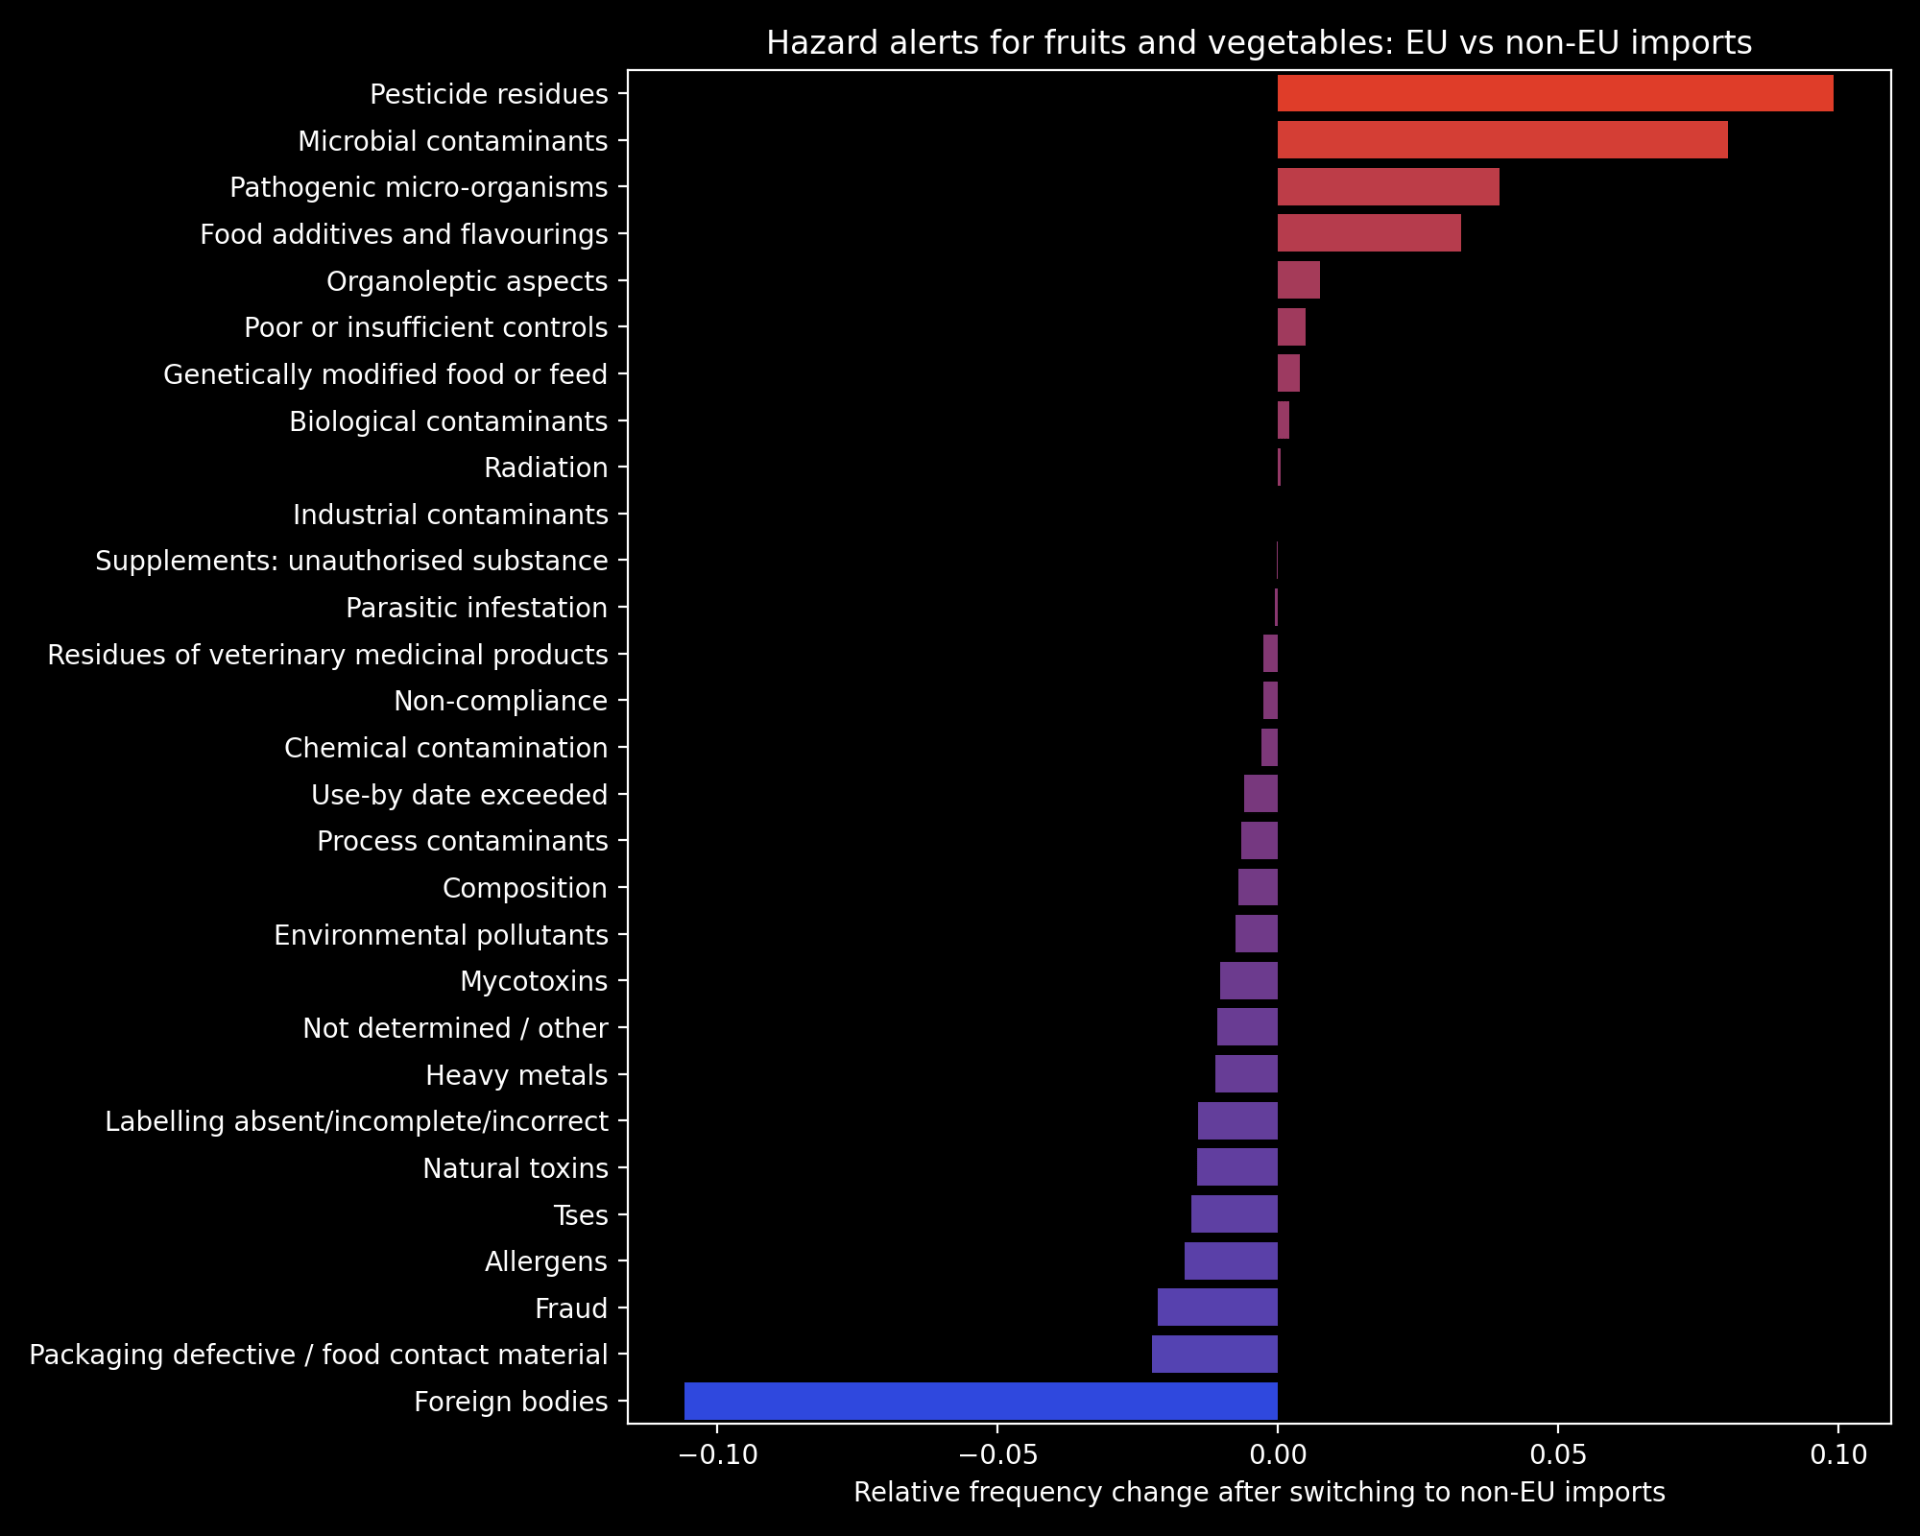
Our full submission ‘Too Much Tooty in the Fruity: Keeping Food Safe in a Post-Brexit Britain’ can be found here, and includes a further breakdown of some of the categories of hazards displayed in the chart above. This work was awarded one of two joint runner-up prizes of the competition, tied with Angharad Stell’s Shiny app: ‘From a data space to knowledge discovery’. The winner of the competition was Robert Eyre, who produced this impressive visualization dashboard using D3. The Jean Golding Institute are hosting a showcase event on the 18th November, where all competition entries will be presented.
We would like to thank the JGI for hosting the competition, and our PhD supervisors, Prof. Tom Gaunt and Dr. Ben Elsworth, for encouraging us to enter.