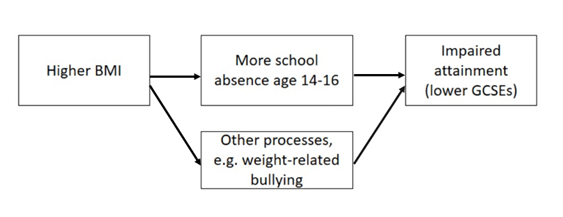
In two-sample Mendelian randomization (MR), a type of epidemiological method, we combine the results from different genetic studies to study the causal relationship between human characteristics and disease. For example, we might take results from a genetic study of smoking and a different genetic study of cancer. We can combine their results to understand whether smoking might be a cause of cancer. If the same position in the genome is associated with smoking in the first study and with cancer in the other study, this can provide evidence that smoking is a causal factor in cancer. However, it’s also possible that this position in the genome could be related to smoking and cancer via separate pathways. This phenomenon is known as “horizontal pleiotropy” and is a common source of bias in Mendelian randomization research.
Another, often under-appreciated, source of bias are errors in metadata. To understand this we need to understand what genetic results look like in practice. Below is an example of a genetic results file with 5 rows and 6 columns (a typical file might actually have several million rows).
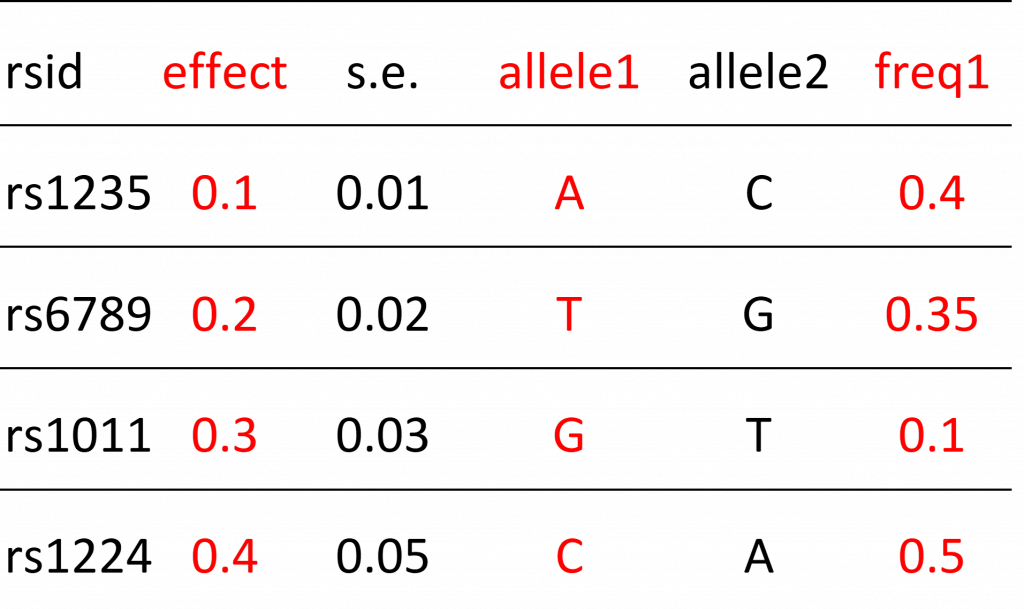
Each row refers to a single position in the human genome that varies between people. These positions are referred to as “genetic variants” (also known as polymorphisms). The particular type of variant that an individual carries is known as their allele.
Below is an example of metadata. The metadata helps us understand the contents of the results file. It tells us what the columns represent.

Some columns in the results file will describe the relationship (“effect” column) between the genetic variant and some human characteristic (e.g. smoking) and there will be additional columns that help researchers interpret this relationship. These additional columns include things like the identity of the allele that is used to model the relationship (e.g. if people have allele “A” they may be more likely to smoke compared to people without this allele) or information on how common the allele is in the population. These columns are also known as the “effect allele” and “effect allele frequency” columns. Metadata errors refer to mistakes in how these columns are reported. For example, maybe allele1 is reported as the effect allele column when in fact it should have been allele 2 that is described in this way. Sometimes the information provided in metadata is ambiguous. For example, the metadata tells us that the “freq” column represents allele frequency but there are two alleles. Is this the frequency of allele1 or allele2? We can’t be sure. Another type of error refers to mistakes in the reported results, for example reporting that a genetic variant increases the probability that a person smokes when in reality it has no effect (in other words the effect is zero). This is known as a summary data error. Failure to identify these errors can lead to mistakes in Mendelian randomization analyses, such as finding that smoking protects against cancer (when we know the opposite is true).
As research complexity increases, so does the potential for errors
These types of errors were fairly easy to avoid during the early years of Mendelian randomization research, when studies tended to be hypothesis-driven and focused on small numbers of relationships (although errors still occurred). Mendelian randomization study designs are, however, increasingly complex and hypothesis-free, sometimes assessing relationships amongst 100s or even 1000s of characteristics and diseases. New online platforms and databases that collate genetic results from many different sources, and provide tools that can automate analyses, make these studies easier to undertake than ever before. The downside is that they probably make meta and summary data errors more likely.
Maximising metadata quality to reduce errors
We address this issue in a new pre-print: “Design and quality control of large scale Mendelian randomization studies”. We present an R package and set of quality control tools that identify meta and summary data errors, which we developed for the Fatty Acids in Cancer Mendelian Randomization Collaboration (FAMRC). The FAMRC is a pan-cancer MR study that seeks to evaluate the causal relevance of fatty acids for risk of major cancers. We wanted to maximise the quality of the genetic study results we collected from the cancer studies, to ensure the integrity of our Mendelian randomization analyses. After implementing our tools, we found major meta and summary data errors in 7 (13%) of 55 genetic studies in the FAMRC.
What types of metadata errors did we find?
The basic principle of our quality control approach is to identify errors through
- comparison of the results of individual studies in the FAMRC to external studies
- comparison of reported to expected results.
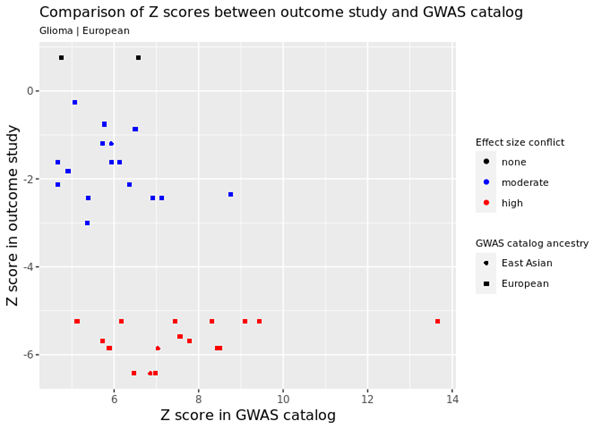
For example, we identified genetic variants that are known to cause cancer and checked that the same variants had the expected relationship in the FAMRC. In the figure below, every data point represents a single genetic variant that is known to increase cancer risk. The horizontal or X axis shows the known relationship in the GWAS catalog (this is a database of known genetic associations with 1000s of human characteristics in 1000s of genetic studies) and the vertical or Y axis shows the relationship in one of the studies in the FAMRC. Each axis shows the Z score, which is basically a standardised measure of how each genetic variant affects cancer risk (positive values mean that the variant increases risk of cancer and negative values indicate they decrease risk). As you can see, in the FAMRC study on the vertical Y axis, almost all the variants have negative Z values (indicating they reduce cancer risk), when in fact they are known to increase risk (the true relationship is represented by Z scores in the GWAS catalog). This discrepancy was caused by a metadata error, where the effect allele column was incorrectly labelled. We also found that the “frequency of the effect allele” was wrong. How common the allele is in the population was opposite to what we’d expect, based on comparison with other studies, confirming the presence of metadata errors.
Various other types of errors were identified, including one study reporting that 100s of genetic variants had very strong effects on fatty acid levels when in fact they had no effect at all. For example, in the figure below, the many red data points refer to genetic variants in the FAMRC that had a very large effect on fatty acids but were not reported in the GWAS catalog, suggesting a potential problem with the genetic results.

We also compared the reported results (how the genetic variants affected fatty acids in the FAMRC) to predicted results (how we would expect the genetic variants to affect fatty acids). In the figure below we see a “fanning-out” pattern, when what we should see is a strong linear relationship (i.e. the data points lying on a single straight line). This relationship can be summarised with the “slope” metric. We should see a slope of 1 (this means if the reported result increases by 1 the predicted result will also increase by 1), which is not the case. We confirmed with the data provider that low quality genetic variants had not been excluded from their study. Once the low quality variants had been excluded, the discrepancies disappeared.

Avoiding metadata errors: recommendations for researchers
When conducting Mendelian randomization analyses using results from genetic studies, researchers can avoid metadata and other errors by:
- Requesting results for genetic variants that are known to affect their disease of interest. Researchers should check that these variants have the expected effect in their dataset.
- Comparing the frequency of genetic variants to expected frequencies in a reference dataset. We created a special reference dataset that can be used for this purpose (accessible via the CheckSumStats R package).
- Not assuming that results have had low quality variants excluded, but instead seeking confirmation of this with data providers. Our quality control tools also provide a way to check this.
Further attention is needed to address the growing diversity of GWAS
One issue we only partly addressed was the “two-sample assumption”: that the studies being compared come from the same population. In our own analyses, we found that the frequency of genetic variants was very similar across European-origin studies, indicating satisfaction of the assumption. On the other hand, our tools were not really optimised for this purpose. The need to assess the “same population” assumption is becoming more urgent with the growing diversity of genetic studies.
In conclusion, meta and summary data errors are an under-appreciated source of bias in MR research, especially in complex study designs. We developed an R package and set of tools that can be used to flag meta and summary data errors in the results of genetic studies, which in turn can be used to enhance the integrity of Mendelian randomization analyses. Our tools and methods are available to other researchers via the CheckSumStats R package.
Further reading
Design and quality control of large-scale two-sample Mendelian randomisation studies
https://www.medrxiv.org/content/10.1101/2021.07.30.21260578v1
CheckSumStats package
https://github.com/MRCIEU/CheckSumStats

 Dr Philip Haycock
