COVID19 – should schools close early for Christmas?

Sarah Lewis, Marcus Munafo and George Davey Smith


We have previously written about the limited risk posed to pupils, teachers and the community by schools being open during the Covid19 pandemic. Schools have now been open for almost a full academic term (3 months), so it is time to take another look at the evidence.

School re-openings have coincided with an increase in Covid19 infection rates across all UK nations. This rise in infection rates was anticipated, given the annual pattern of rising respiratory infections in the autumn term. There was also a rapid increase in Covid19 testing rates as children returned to school and presented with mild symptoms. Rates of positivity among children were very low at first, but a rise was observed over the autumn. This corresponded with an increase in rates among adults, and there seems to be a strong correlation between Covid19 positivity in schools and rates in the local community.

But has transmission of Covid19 in schools driven the second wave? And should schools be closed again to reduce infection in the community?

This post argues that there is little case for closing schools, as

  • Schools don’t seem to drive transmission in the community
  • The risk of the virus to most school children is very low
  • The harms of school closures are wide ranging.
Photo by CDC on Unsplash

Infection rates among children have been low

Since September children with COVID19 symptoms have been asked to stay at home and have a test before returning to school. Tests equating to 10% of the school pupil population were carried out during first half term in Scotland; only 0.2% of pupils tested positive during this period. Similarly high volumes of testing have been carried out in Wales, but only 0.6% of pupils tested positive between 1st September and 9th December 2020. Pupils made up 3.5% of cases in Wales over that period, despite making up 16% of the population.

However, the weekly Covid19 incidence among 12-16 year olds in Wales was similar to the national average for the week ending 9th December 2020, suggesting a change in the age demographic of cases.

Transmission levels in school have been low

It is unclear what proportion of children who tested positive contracted the infection in school – many children have similar social circles both in and out of school. When infections are found in schools, most schools have only 1 or 2 cases within a 2-week period (unless levels in the local community are high). This suggests low levels of transmission in schools.

Children and adults have different symptoms

Comparisons of rates of infection between children and adults should be treated with caution. Cases are diagnosed using recognised Covid19 symptoms, and are influenced by the volume of testing in the community. Younger children seem to be less likely to have symptoms – around 50% of infected children tend to be completely asymptomatic.  They also may have somewhat different pattern of symptoms to adults – fatigue, gastrointestinal symptoms, and changes in sense of smell or taste, but only rarely a cough. Therefore, studies relying on symptoms in children may be unreliable.

Random testing is the best way to find out level of infection

Surveys show that while young adults had the highest levels of infection in September, secondary school pupils now have the highest rates.

Studies which test individuals at random in the community are more reliable indicators of the levels of infection among children compared to adults. The UK Office of National Statistics (ONS) infection survey has been randomly testing people from the community since early May. It showed that young adults (school year 11 to age 24) had the highest positivity rates in September. This became more pronounced in early October when universities re-opened to students. By the end of October, rates among secondary school pupils were similar to those in young adults, at around 2%. Secondary school pupils now have the highest rates. Covid19 positive rates among primary school children are about half those in secondary school children and have barely changed since the beginning of the academic year.

Infection rates among teachers

There is no evidence that teachers are more at risk of death from COVID19, and infection rates among teachers do not seem higher than other professions.

ONS data from the first wave of the COVID19 epidemic in the UK showed that teachers were not at increased risk of death from the disease compared to other professionals. Based on ONS data, during October those working in the education sector had an antibody positivity rate of 8.1% (95% CI 5.9-10.8) compared with 6.5% (95% CI 5.9-7.3) among those working in other professions. This suggests perhaps slightly higher infection rates, but this is estimated with uncertainty.

Infection positivity rates – also measured by the ONS survey –  from 2nd September to 16th October showed that teachers were no more likely to test positive than other professions, although again there was a lot of uncertainty in these estimates*.  The Swedish Public Health Agency have linked data on Covid19 infection to occupational data and found no increase in infection rates among teachers, although there was some evidence of an increase in infection rates among teaching assistants, school counsellor and  headteachers. However, infection rates may have been inflated relative to other profession if there is  increased testing among asymptomatic people in the education sector.

Photo by Jeswin Thomas on Unsplash

Could infections in schools be driving community infection rates?

The evidence suggests this is unlikely.

Infection rate increases appear to coincide with school openings, but the R-number was increasing in Scotland and England before school openings. Hospital admissions due to Covid19 had also started to rise before this point. In September, positivity rates were initially highest among young adults, not among children of school age, suggesting that perhaps infections among school children were not driving community rates. The ONS data showed infection rates levelling off over October half term, and climbing again among young adults and secondary school children after half term. However, this trend was not as marked in primary school children, and was not observed in adults, even amongst the 35-49 year age group, to which many parents of school aged children belong. Another study of community-based testing – the REACT-1 study – found a greater decrease in infections among younger children compared with older children following the October half term holiday, but again there was a lot of uncertainty in this estimate.

Contact mixing patterns show that people tend to have the most contacts within the same age group, followed by the age group closest to them. Children have more opportunities to pass on the infection to other children and young adults, and are not significantly influencing rates in older adults.

The current R-number in England is currently estimated to be slightly below 1 despite schools being open. This shows that it is possible to drive down infection rates in the community whilst keeping schools open. Furthermore, when everything else but schools are closed – such as in the case of the national lockdown which occurred in England in November, school children will have more contacts than anyone else and schools will contribute to relatively more transmissions in the community even if transmission rates are low overall.

Closing schools is not the answer

Rates have recently fallen among adults in England, despite schools remaining open and secondary school rates increasing. The evidence suggests low levels of virus transmission within schools. First Minister of Wales Mark Drakeford recently said that behavioural evidence suggests closing schools could place some children “in even riskier environments”. Children being looked after by their grandparents rather than being in school would be more dangerous in terms of the virus being transmitted to a higher risk group.

Any public health intervention should consider the costs as well as the benefits. We know that school closures have wide ranging adverse consequences for children and families as outlined by UNESCO, and such costs are particularly pronounced for the poorest and most vulnerable children in society. Children:

  • who do not have access to technology to participate in online learning
  • whose parents who do not have the resources or the educational background to help

have been shown to fall further behind following school closures. Evidence suggests that children’s mental health deteriorated during the first lockdown, and that vulnerable children were at greater risk of violence and exploitation. School closures can also cause economic hardship due to parents being unable to work.  This has prompted Robert Jenkins Global Chief of Education at UNICEF to issue a statement over the last few days saying:

“Evidence shows that schools are not the main drivers of this pandemic. Yet, we are seeing an alarming trend whereby governments are once again closing down schools as a first recourse rather than a last resort. In some cases, this is being done nationwide, rather than community by community, and children are continuing to suffer the devastating impacts on their learning, mental and physical well-being and safety”.

If schools being open are not major drivers of transmission in the community (which they don’t appear to be), given that the risk of the virus to most school children is very low, there is very little case for closing them given the potential harm this could cause.

Footnote: Secondary schools in Wales were closed early for Christmas on the 11th December 2020

*(estimates ranged from 0.2% (95%CI=0.07-0.53) for primary school teachers to 0.5% teachers of unknown type (95% CI=0.36-0.69) compared with 0.4% (95%=0.39-0.49) for all other professions)

Drinking in pregnancy: the right to record, or the right to privacy?

Luisa Zuccolo , MRC Integrative Epidemiology Unit and Department of Population Health Sciences, Bristol Medical School, University of Bristol

Cheryl McQuire, School for Public Health Research/Centre for Public Health and Department of Population Health Sciences, Bristol Medical School, University of Bristol

Follow Luisa and Cheryl on TwitterCheryl McQuireLuisa Zuccolo

What’s the issue?

Drinking alcohol during pregnancy continues to stir passionate and polarised reactions. The issue has once again come into sharp focus. In England, the National Institute for Health and Care Excellence (NICE) is proposing to measure all alcohol use in pregnancy and transfer this information to a child’s health records, without explicit agreement from the mother. The aim of the proposal is to ensure better diagnosis and support for those with lifelong conditions caused by drinking in pregnancy that can include problems with learning, behaviour and physical abnormalities, known as Fetal Alcohol Spectrum Disorders (FASDs). However, the NICE proposal has been met with strong opposition from some organisations, which say that this breaches pregnant women’s right to medical privacy.

A balancing act

Benefits of introducing the proposed FASD NICE Quality Standards

It’s important to remind ourselves why measuring and sharing information on drinking in pregnancy could be worthwhile, and who will benefit.

Information – the key to understanding

Official guidance recommends that it is safest not to drink at all during pregnancy, or when trying for a baby. But a quarter of people in the UK are not aware of this guidance and the UK has the fourth highest rate of drinking in pregnancy in the world. The new NICE quality standards propose to rectify this by making it compulsory for midwives (or other health care professionals) to have conversations about alcohol with pregnant women.  The idea is to help women to make informed choices about drinking in pregnancy.

Information is in everyone’s interest. We still don’t know enough about the effects of different levels of alcohol use in pregnancy. This is a tricky area to study, in large part because we don’t have enough information. If we don’t measure, we can’t fully understand the effects of alcohol in pregnancy (not even to confirm whether small amounts are safe). This has been our area of research for a number of years, and it is important both because many pregnant women drink alcohol, and because they should have the right to be better informed. Current abstinence guidelines are largely (but not solely) based on the precautionary principle. Our research has provided some evidence that even low levels of use (two drinks a week or fewer) can have negative effects, including smaller babies and preterm birth. We need more information to find out about the full extent of these risks – including whether the risks are genuinely there – to ensure that women can make informed decisions based on the best possible evidence.

Diagnosing fetal alcohol spectrum disorders (FASD)

Fetal alcohol spectrum disorders are severely underdiagnosed. They are characterised by lifelong problems with learning, behaviour and, in some cases, physical abnormalities. Contrary to what many think, these are common disorders. Our recent research suggests that between 6 and 17% of children in the UK could have symptoms consistent with FASD. Without good information on exposure to alcohol in pregnancy, many of these children remain ‘invisible’ to services and do not get the support that they need.

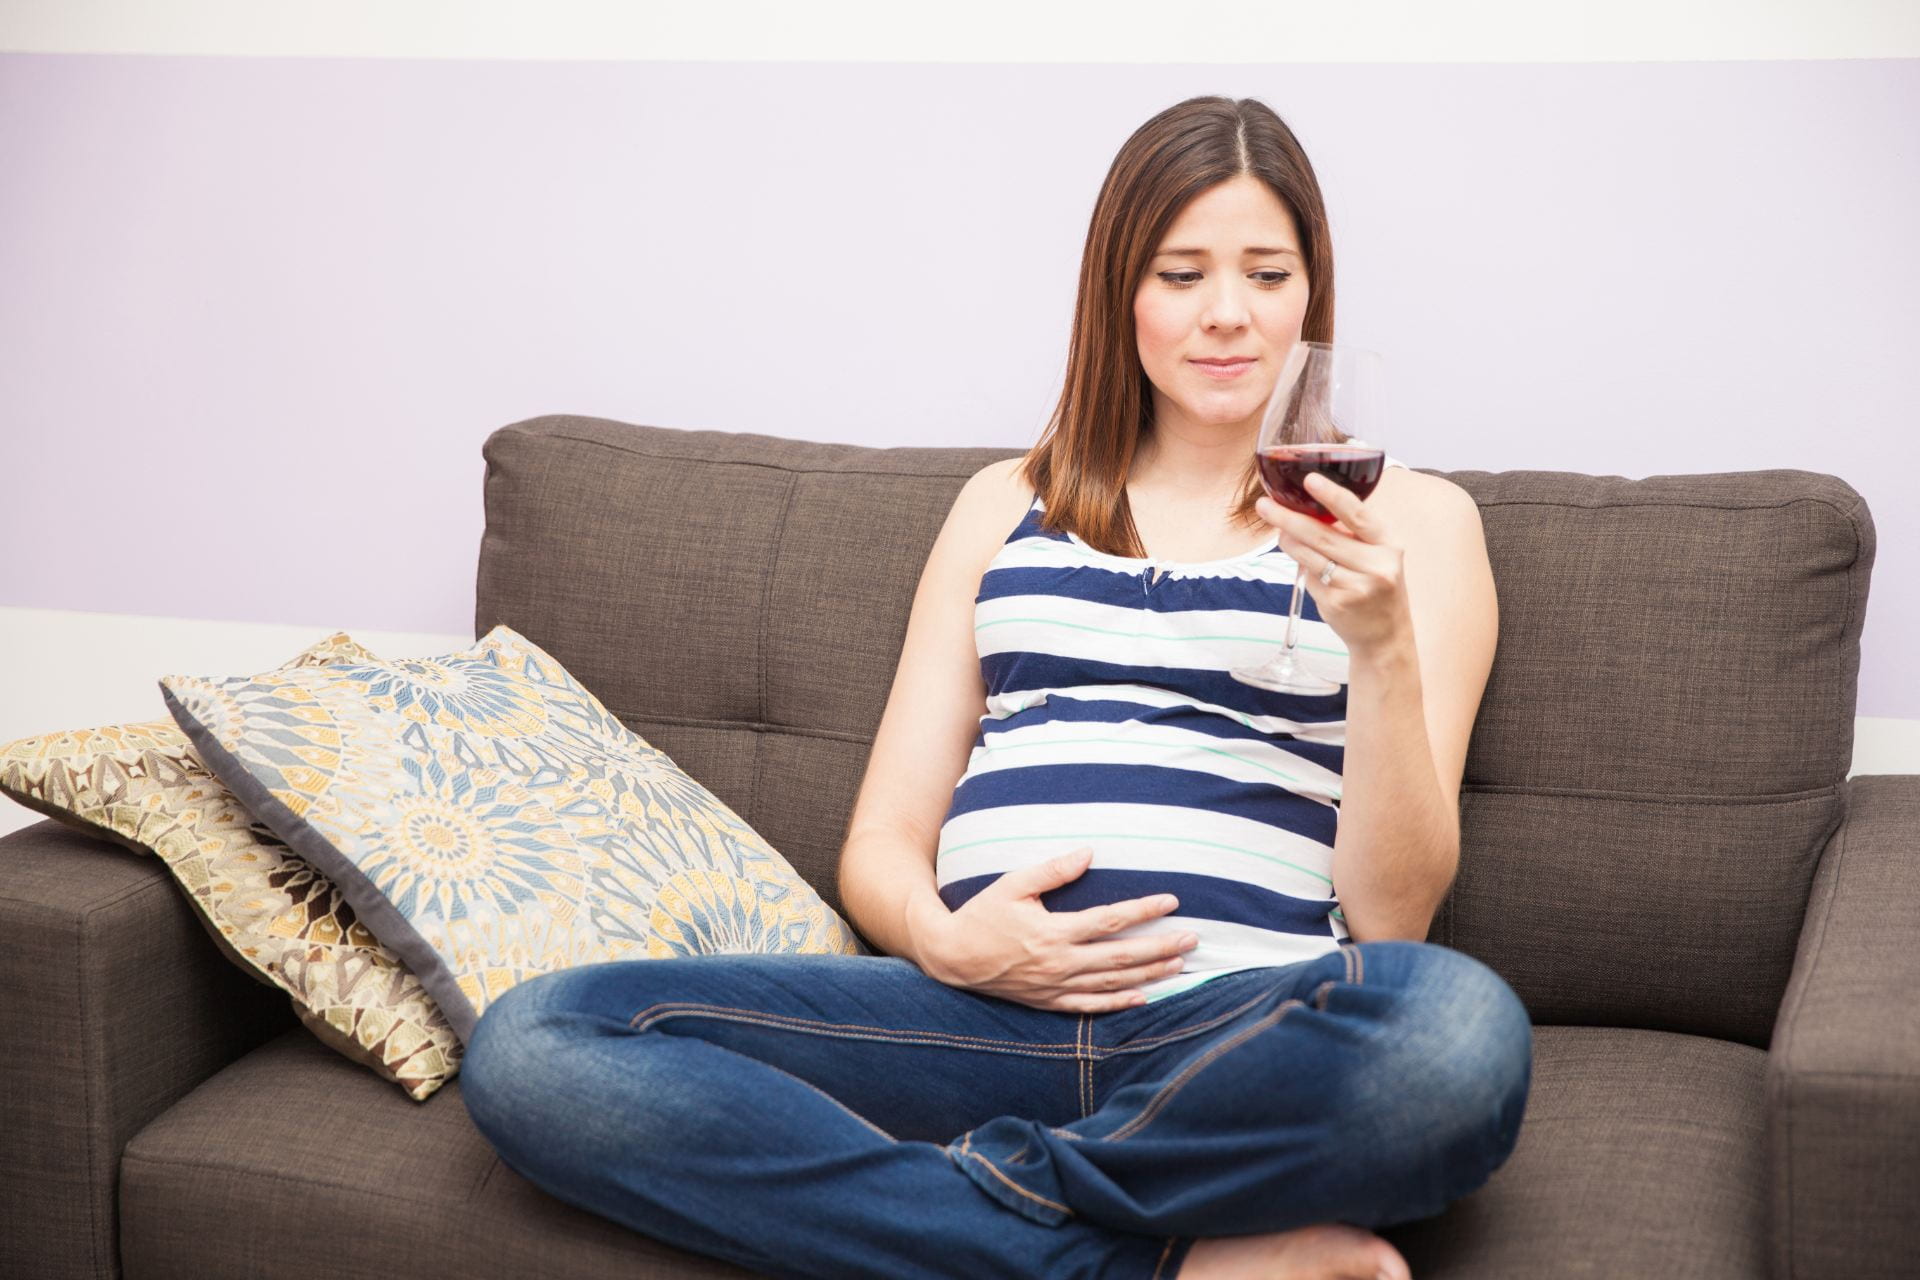
Pregnant woman holding a glass of red wine

Concerns about the Quality Standards

Despite the potential benefits of these proposals, there are several unresolved issues that need tackling urgently.

Stigma and trust

If women feel stigmatised, they might lie about their drinking, invalidating any data collection. If they can’t trust their healthcare providers, then we can’t trust the data – so what would be the point of collecting it?

Tradeoffs

What would women be offered, in exchange for volunteering this information? What’s in it for them? It would be unbalanced and probably unethical to request information about drinking in pregnancy, at the risk of stoking maternal anxiety, without explaining the reasons, or offering support if so desired. The treatment of pregnant women who smoke provides an appropriate model – information is recorded on antenatal notes, and support to quit is offered at the same time. We need to guarantee a non-judgmental and supportive approach to listening when it comes to alcohol too.

Confidentiality

Women should be able to opt out. For those opting in, it should be made clear that the same high levels of confidentiality will apply as are already in place for current information from maternity notes and child health records. These new data on alcohol use should be no different and must be covered by existing guarantees.

Finding the right balance

So, where is the balance between the benefits and risks of the proposed changes? We often talk about burdening pregnant women with anxieties, but we neglect to talk about the lifelong consequences of emotional and behavioural problems arising from exposure to alcohol in pregnancy – these pose real everyday challenges for families, for many years to come. If on the one hand, maternal health is child health, then on the other child health is maternal health.

As we hear in these COVID-19 times, health is a marathon not a sprint

We need to continue shifting the focus from ‘healthy pregnancies’ to ‘healthy families’. The former can be met with resistance by those evoking the dangers of the surveillance state and policing women’s ‘baby-making’ bodies. The latter reminds us of the many individuals involved, all equally important, all of whom need support for the long term beyond those initial nine months.  We believe that NICE should listen to the plurality of women and families’ voices. The debate on recording alcohol in pregnancy will lead to constructive health gains that will benefit all.

Visualising Brexit’s Impact on Food Safety in Britain

Written by Marina Vabistsevits and Oliver Lloydresearchers on PhD studentships linked to the  “Data Mining Epidemiological Relationships” programmeat theMRC IEU. 

Follow us on twitter – @marina_vab,  @PlotThiggins 

Leaving the EU presents many unique challenges to Britain, among which is the crucial task of maintaining our high levels of food safetyAs a submission to the Jean Golding Institute’s data visualisation competition, we briefly investigated the impacts that Brexit may have on British food supplies. The dataset used in this analysis was made available by the Food Standards Agency (FSA) as the focus of the competition, and all code used is freely available in our github repository. 

The Need for Information Recompense 

In the first part of the analysis, we explored cases where food imported to Britain led to an alert being raised. The two biggest sources for such alerts were Britain’s internal alert systems (largely the FSA), and the EU’s Rapid Alert System for Food and Feed (RASFF).  

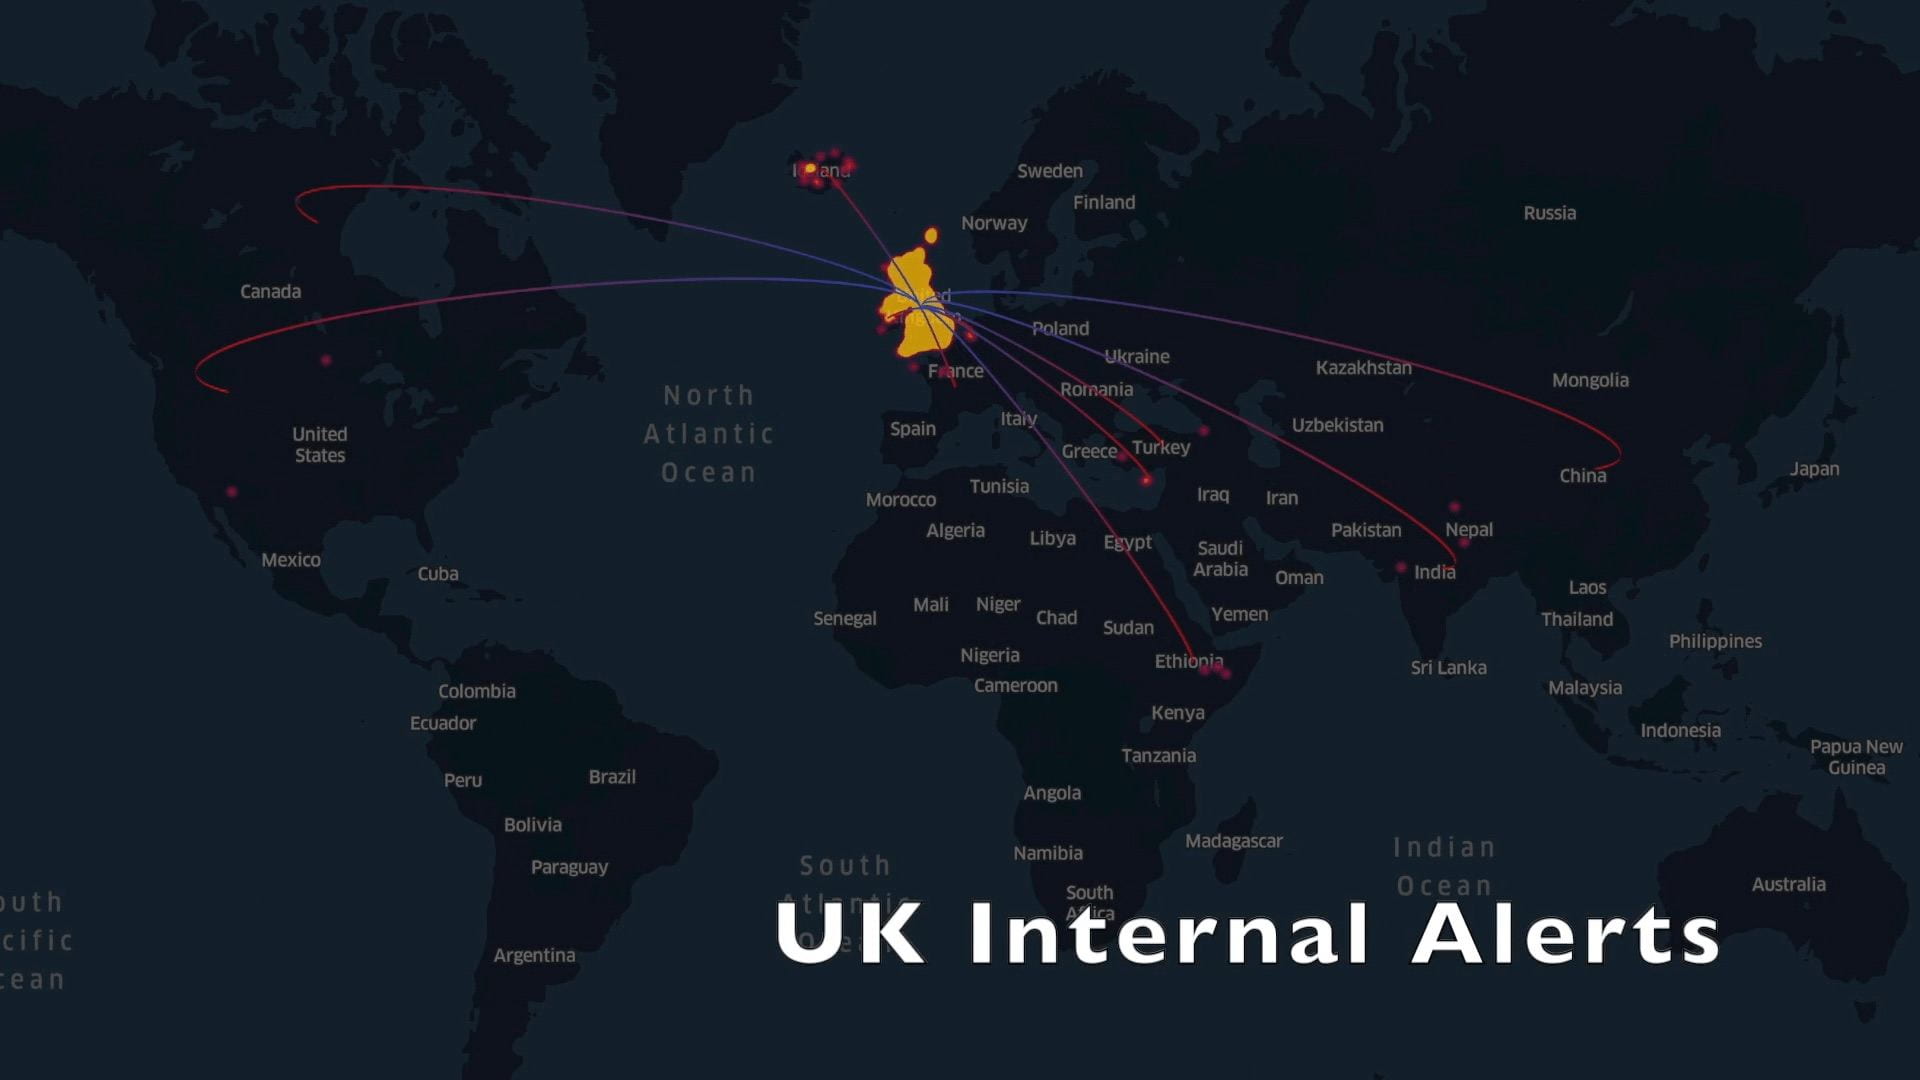
Since Britain is on course to lose access to RASFF-supplied information once Brexit is finalised in early 2021, we created the visualisation below as a comparison of the FSA and the RASFF in terms of both the number of alerts raised and the corresponding food’s origin country for each alert.  


Map of the world where lines between the UK and other countries indicate the countries where alerts from the Rapid Alert System for Food and Feed have originated from
Alerts from the EU Alert System

The arcs show the countries of origin of imports that raised alerts, and the yellow-red density map shows the recorded hazard alert frequency from those origins. Interactive versions of the two map instances can be found by following these linksRASFFUK internal alerts. 

Map of the world where lines between the UK and other countries indicate the 8 countries where alerts from the UK Internal alerts have originated from
Alerts from the UK Alert System

If the UK does indeed lose access to the RASFF, the loss of food hazards information about our own imports will be tremendous. The burden then falls on the FSA to develop and extend their alert system (which currently focuses very little on internationally supplied food) to bridge this information gap and ensure food safety for globally imported goods. As of the time of writing we are unsure what steps are being taken by the FSA, or the government at large, to address this issue. 

Post-Brexit Shifts in Food Hazard Threats  

As an extension of this work, we turned our attention to tariffs and the effect they might have on whom Britain chooses to import from. Upon leaving the EU the UK will have to negotiate new trade deals with both EU and non-EU countries. Since the cost for EU-produced food is expected to rise for Britain after Brexitwe may indeed see Britain importing more from outside of the union, which would naturally bring a shift to the makeup of food hazards that our alert systems will need to detect. Anticipating this shift will allow us to better mitigate the accompanying risk if it does begin to materialise.  

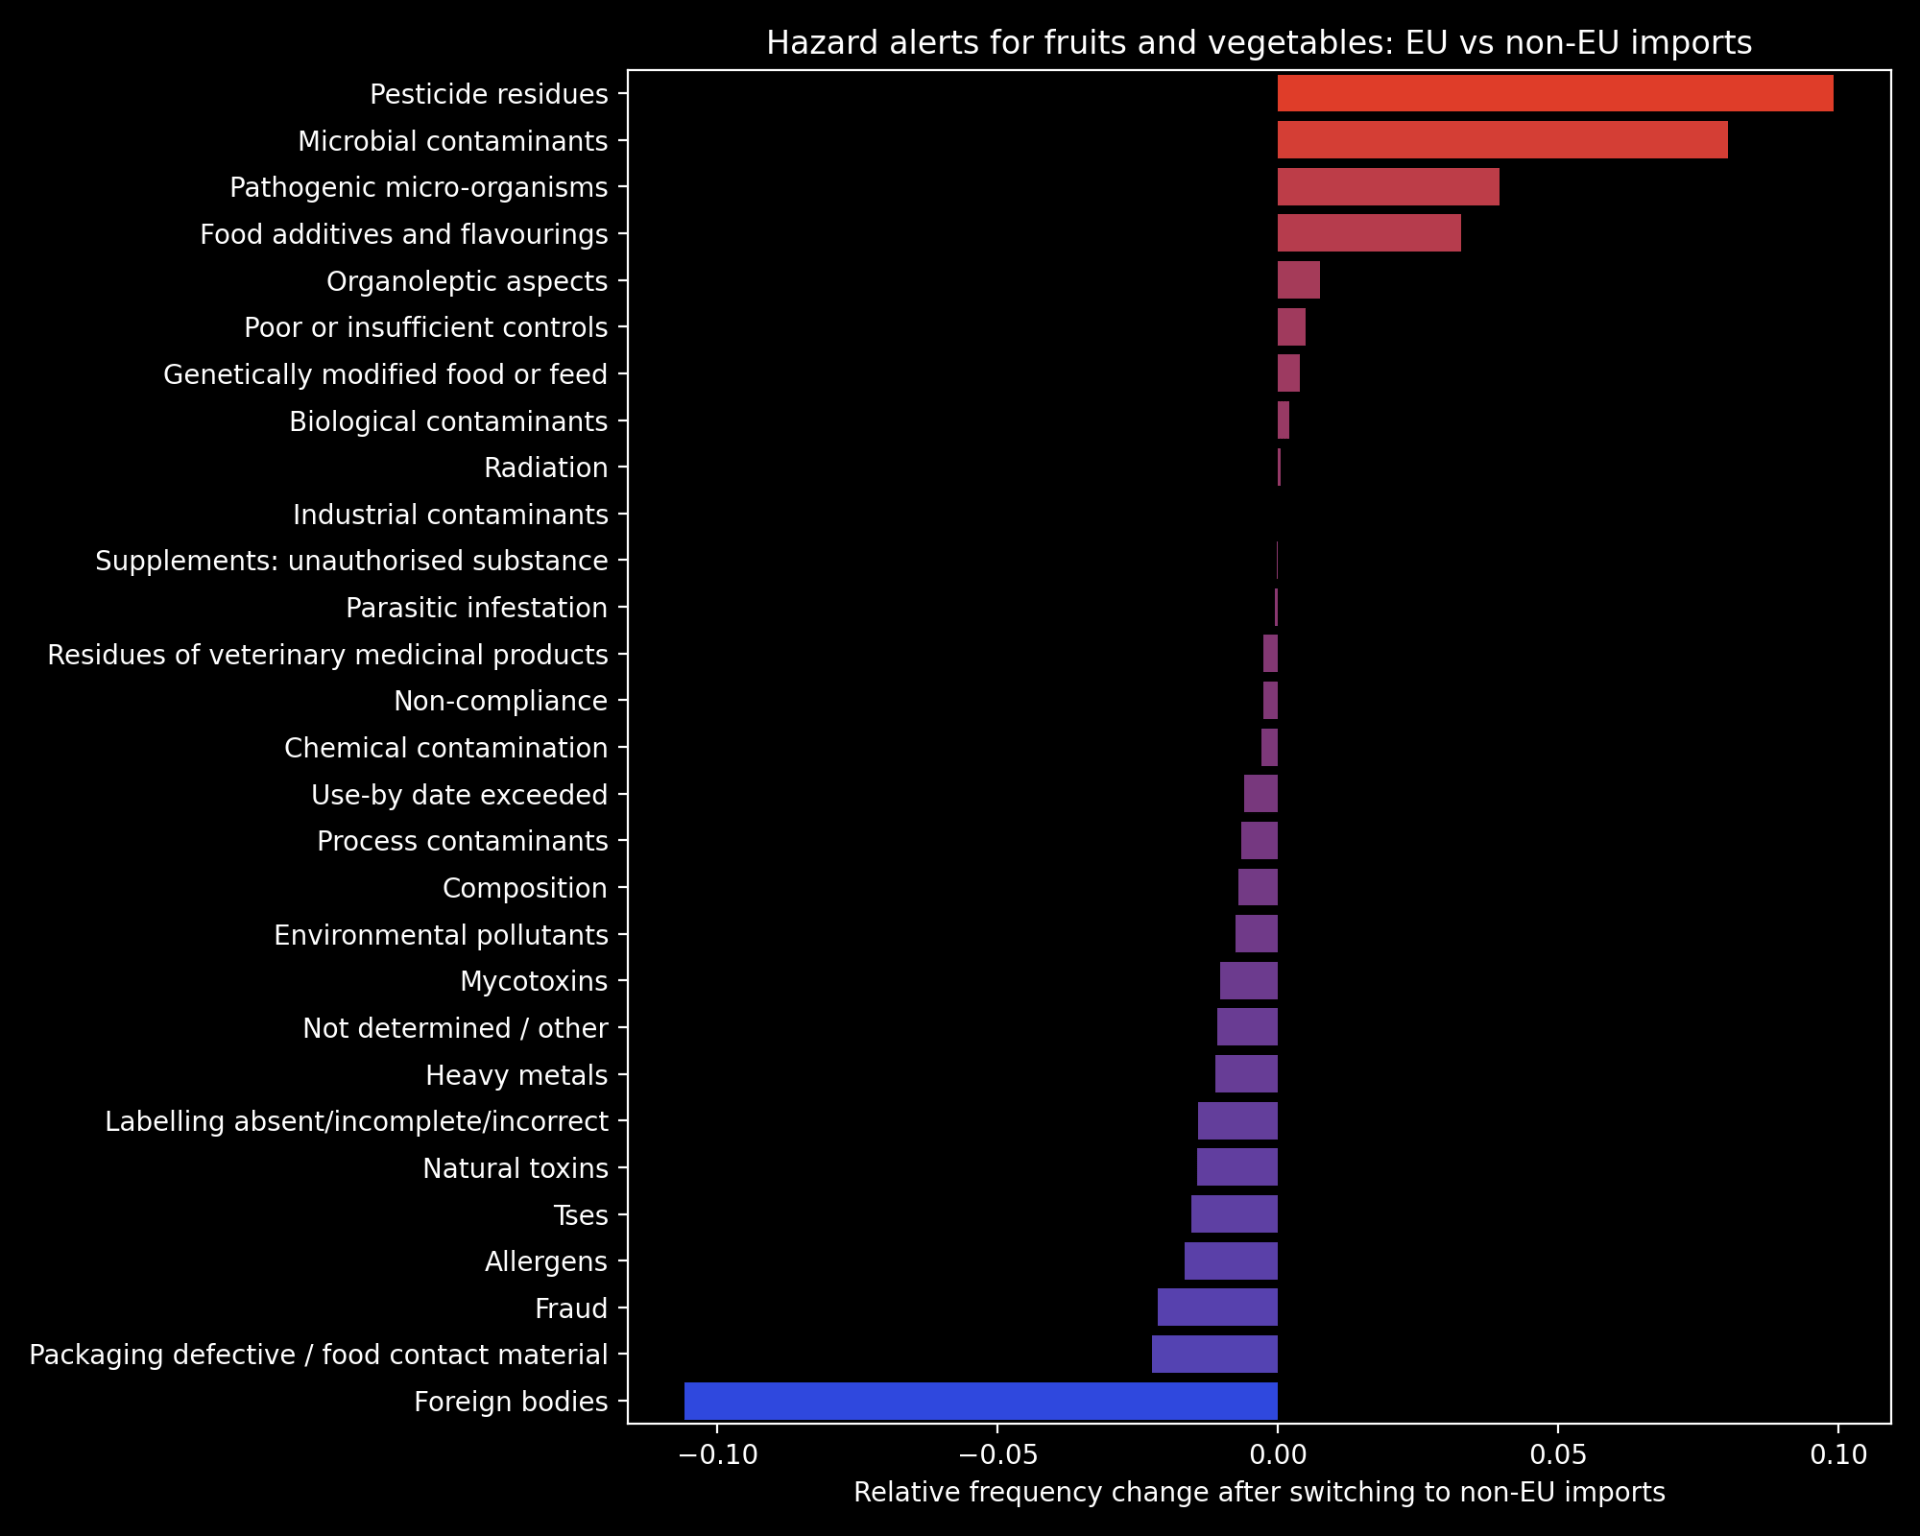
To this end, we explored the differences in food hazard threats posed by EU vs non-EU suppliers of Britain’s largest class of imported food: fruits and vegetables. The plot below shows the relative change in frequency for each category of food hazard in the case that Britain switched from 100% EU imports of fruit and vegetables to 100% non-EUThe hazard categories that are likely to increase in non-EU imports are highlighted in red.  Please note that this is the most extreme case possible and is unlikely to unfold to this extent in reality– this plot is therefore presented as a guide to the different food threats posed by EU vs non-EU imports. 

Bar chart showing difference in frequency of various food hazards, such as foreign bodies and allergens, after switching to non EU imports
Hazard alerts for fruits and vegetables: EU vs non-EU imports

Our full submission ‘Too Much Tooty in the Fruity: Keeping Food Safe in a Post-Brexit Britain’ can be found hereand includes a further breakdown of some of the categories of hazards displayed in the chart above. This work was awarded one of two joint runner-up prizes of the competitiontied with Angharad Stell’s Shiny app: ‘From a data space to knowledge discovery’. The winner of the competition was Robert Eyre, who produced this impressive visualization dashboard using D3. The Jean Golding Institute are hosting a showcase event on the 18th November, where all competition entries will be presented.  

We would like to thank the JGI for hosting the competition, and our PhD supervisors, Prof. Tom Gaunt and Dr. Ben Elsworth, for encouraging us to enter. 


How has the COVID-19 lockdown affected children born with a cleft lip/palate?

Written by the Cleft Collective Team

Follow the Cleft Collective on twitter.

The COVID-19 pandemic has been difficult for many families and there is widespread concern about how the lockdown might have affected children’s health, wellbeing and education. This concern may be even greater for families of children with pediatric health conditions such as cleft lip and/or cleft palate.

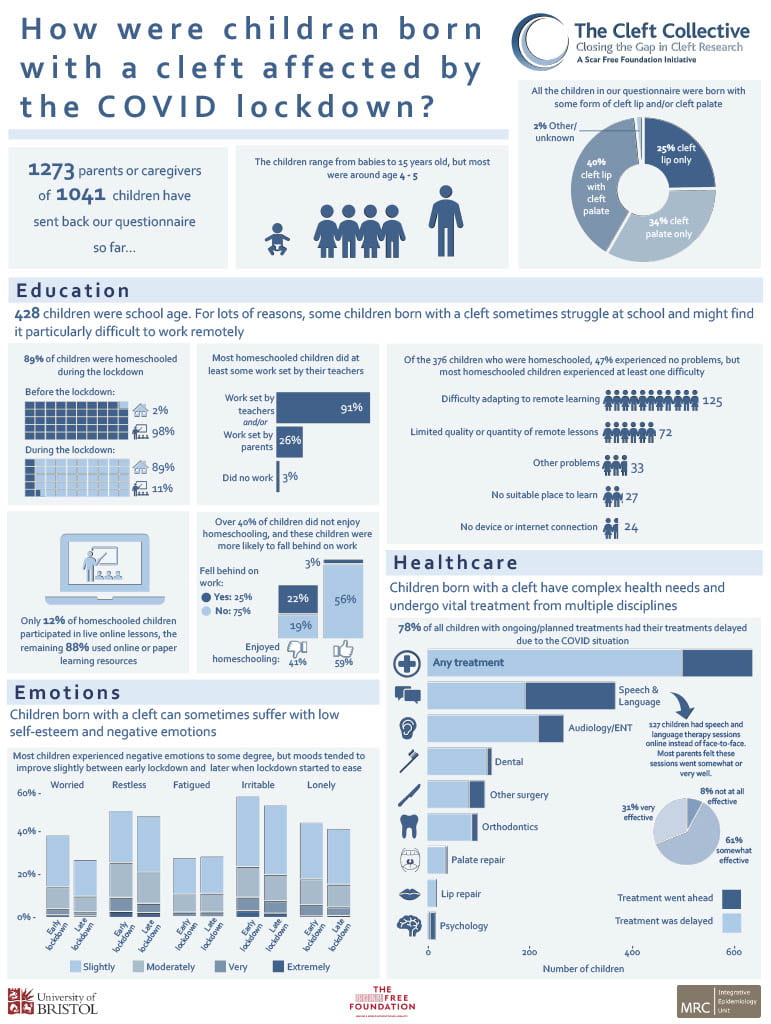
The Cleft Collective cohort study, linked to the IEU, is a UK-wide research study of the causes and consequences of being born with a cleft, which is a gap in the lip or roof of the mouth. In response to the COVID-19 lockdown, the Cleft Collective team sent out a questionnaire asking parents about how the lockdown had affected their children’s surgeries and treatments, access to schooling and wellbeing.

The first results are summarised in this infographic, which highlights that many children suffered delays in their surgeries and other health care appointments due to the lockdown. They also struggled with homeschooling, worries and negative emotions.

Through links to the NHS cleft teams and the Cleft Lip and Palate Association charity (CLAPA), the Cleft Collective team are sharing their findings with healthcare professionals to help ensure that children born with a cleft are given appropriate support to help them through this time and to lead happy, healthy childhoods.

The Cleft Collective cohort study is based in the MRC Integrative Epidemiology Unit and funded by the Scar Free Foundation and the University of Bristol. The video below explains more about the study.

Epigenetics regulate our genes: but how do they change as we grow up?

Rosa Mulder1,2                    Esther Walton3,4 & Charlotte Cecil1,5,6

Follow Esther and Charlotte on Twitter.

Epigenetics can help explain how our genes and environment interact to shape our development. Interest in epigenetics has grown increasingly within the research community, but until now little was known about how epigenetics change over time. We therefore studied changes in our epigenome from birth to late adolescence and created an interactive website inviting other researchers to explore our findings.

What is epigenetics?

The term ‘epigenetics’ refers to the molecular structures around the DNA in our cells, that affect if, when, and how our genes work. Even though nearly every cell in our body contains the exact same copy of DNA, cells can look and function entirely differently. Epigenetics can explain this. For example, every cell in our body has the potential to store fat, but in adipose tissues the cells’ epigenetic structures cause the cells to actually store fat.

Before birth, epigenetics plays a role in the specialization of cells from conception onwards by turning genes ‘on’ and ‘off’. After birth, epigenetics help our body develop even further, and maintain the specialization of our cells. However, the way epigenetics influence how our cells function is not only programmed by our genes, but may also be affected by the environment. Hence, our development and health is shaped by both our genes and our environment. Researchers are therefore trying to measure epigenetic processes to understand the role that epigenetics plays in this process of ‘nurture affecting nature’.

Both nurture and nature influence our health; understanding epigenetics helps us to find out how they might interact.

How can we measure epigenetics?

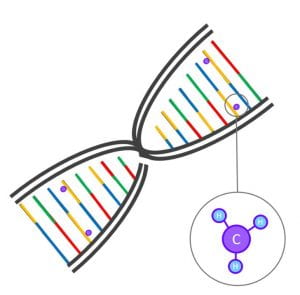
One of the types of molecular structures that can affect gene functioning is ‘DNA methylation’. Here, a small molecule (a methyl group of one carbon atom bonded to three hydrogen atoms; Figure 1) is attached to the DNA sequence. DNA methylation affects the three-dimensional structure of the DNA and can thereby turn it ‘on’ or ‘off’. DNA methylation can now easily be measured in the lab with the help of micro-chips; very small chips that can detect hundreds of thousands of methylation sites in the genome at a time, from just a small droplet of blood. Such chips are now used in large epidemiological cohorts such as ALSPAC to measure the level of DNA methylation for each of these sites. In epigenome-wide associations studies (EWASs), researchers study the associations between each of these methylation sites and a trait, such as prenatal smoking, BMI, or stress.

Figure 1: DNA sequence with DNA methylation

How does DNA methylation change throughout development?

Until recently, EWASs have mainly been cross-sectional, studying DNA methylation only at one time-point. So, even though research indicates that epigenetics is important in postnatal development, we do not know how true this is for DNA methylation sites measured with these epigenome-wide arrays. Studying a mechanism that supposedly changes over time without  knowing how it changes can be problematic: say that we find an association between smoking during pregnancy and DNA methylation at birth, can we still expect this association to be there at a later age? To fully interpret EWAS findings, and to compare research findings between different studies, we need a full understanding of how DNA methylation changes throughout development.

We therefore set out to study DNA methylation from birth to late adolescence, using DNA methylation measured in blood from the participants of ALSPAC in the UK, as well as from participants from another large cohort, the Generation R Study in the Netherlands.

We studied the change in levels of DNA methylation over time as well as variation in this change between individuals. If DNA methylation is indeed mainly linked to the basic developmental stages we go through as we grow up, we would expect methylation changes to be largely consistent between individuals. However, if DNA methylation is affected more by the different environments we live in, and individual health profiles, we would expect a proportion of sites to change differently for different individuals.

Between ALSPAC and Generation R, we created a unique dataset containing over 5,000 samples from about 2,500 participants with DNA methylation measurements at almost half a million methylation sites measured repeatedly at birth, 6 years, 10 years, and at 17 years. With various statistical models we studied different trajectories of change in DNA methylation.

We found change in DNA methylation at just over half of the sites (see for an example Figure 2a). At about a quarter of sites, DNA methylation changed at a different rate for different individuals (Figure 2b). We further saw that sometimes change only happened in a specific time period; for example, only in between birth and the age of 6 years after which DNA methylation remained stable (Figure 2c), and that sometimes differences in the rate of change only started from the age of 9 years (Figure 2d). Last, for less than 1% of the sites on the chromosomes tested (we did exclude the sex chromosomes), we saw that DNA methylation changed differently for boys and girls (Figure 2e).

Figure 2. Different examples of methylation sites, with every graph representing one methylation site with age on the x-axis and level of DNA methylation on the y-axis. Every line represents change in DNA methylation over time for one individual, showing (a) change in DNA methylation, (b) different rates of change for different individuals, (c) change during the first six years of life, (d) different rates of change starting from 9 years of age, (e) different change for boys and girls, and (f) change, but no differences in rate of change in a site associated to prenatal smoking.

How can we use these findings in future research?

These results show that there are sites in the genome for that show change in DNA methylation that is consistent between individuals, as well as sites that change at a different rate for different individuals. We have published the trajectories of change for each methylation site on a publicly available website. This makes it easier for other researchers to find sites that are developmentally important and may be of relevance for health and disease. For example, a methylation site previously associated with prenatal smoking, remained stable over time (Figure 1f), indicating that prenatal influences of smoking may be long-lasting, at least up to adolescence. In the future, we hope to associate traits, such as stress and BMI, to these longitudinal changes, to further our understanding of the developmental nature of DNA methylation and the associated biological pathways leading to health and disease.


1Department of Child and Adolescent Psychiatry/Psychology, Erasmus MC, University Medical Center Rotterdam, Rotterdam, the Netherlands

2 Department of Child and Adolescent Psychiatry/Psychology, Erasmus MC, University Medical Center Rotterdam, Rotterdam, the Netherlands

3 MRC Integrative Epidemiology Unit, Population Health Sciences, Bristol Medical School, University of Bristol, Bristol, UK

4 Department of Psychology, University of Bath, Bath, UK

5 Department of Epidemiology, Erasmus MC, University Medical Center Rotterdam, Rotterdam, the Netherlands

6 Department of Psychology, Institute of Psychology, Psychiatry & Neuroscience, King’s College London, London, UK


Further reading

Mulder, R. H., Neumann, A. H., Cecil, C. A., Walton, E., Houtepen, L. C., Simpkin, A. J., … & Jaddoe, V. W. (2020). Epigenome-wide change and variation in DNA methylation from birth to late adolescence. bioRxiv. (preprint)

Epidelta project website: http://epidelta.mrcieu.ac.uk/

Can we ever achieve “zero COVID”?

Marcus Munafo and George Davey Smith

Follow Marcus and George on Twitter

An important ongoing debate is whether the UK’s COVID strategy should focus on suppression (maintaining various restrictions to ensure the reproduction rate of the SARS-CoV-2 virus remains at or below 1), or elimination (reducing the number of infections to a sufficiently low level that restrictions could be removed). Independent SAGE has explicitly called for a “zero COVID UK”.

The latter is attractive, in that it brings the promise of a return to normality, rather than the ongoing maintenance of distancing measures, use of face coverings, etc. Independent SAGE has suggested that “a seven day rolling average of one new case per million per day could represent ‘control’” under a “zero COVID” regime. In other words, around 60 to 70 new cases per day across the UK.

But is “zero COVID”, in the context of ongoing large-scale testing, ever likely to be possible?

It’s unclear how accurate COVID19 tests are – which presents a challenge for the aim of reaching ‘zero COVID’.

Knowing how many cases there are in a population requires testing. But even the best tests are not perfect. Unfortunately, it might be difficult to know exactly how accurate COVID tests are – the RT-PCR (antigen) tests for SARS-CoV-2 are likely to be highly specific, but in the absence of an alternative gold standard to compare these against, calculating the precise specificity is challenging

If we assume excellent specificity (let’s say 99.9%), at current levels of daily testing in the UK (74,783 tests per day processed across pillars 1 and 2, as of the 28th July update), that would mean around 75 false positive results per day even if there were no true cases of COVID in the UK. A sensitivity of 98% would mean over 1400 false positives *.

Any call for “zero COVID” needs to consider the impact of false positives on the achievability of the criterion that would constitute this, against a background of high levels of testing. Whilst testing is only one source of information that needs to be interpreted in the light of other clinical and epidemiological data, on their own they will be important drivers of any response.

As cases fall to a low level, perhaps we could reduce levels of testing (and therefore the number of false positives). But, given the high potential for substantial undocumented infection and transmission, it is likely that large-scale testing will remain essential for some time, if only to monitor the rise and fall in infections, the causes of which we still don’t fully understand.

The generic Situationist slogan “be realistic, demand the impossible” is one that many political campaigns for equality and freedom can understand.

But in many concrete situations well-meaning phrases can prove to be meaningless when scrutinised. If attempts to achieve zero COVID before relaxing restrictions leads to a delay in the reopening of schools, for example, that will result in vast increases in future levels of inequality in educational outcomes, and the future social trajectories dependent on these.

As with other endemic human coronaviruses, SARS-CoV-2 will likely show high variability and fall to very low levels within any particular population for sustained periods; it will not be permanently eliminated on a continental scale, however. Perhaps a better alternative to the setting of laudable but effectively unachievable targets is to recognise this and plan accordingly.

Marcus Munafò and George Davey Smith

* The importance of the sensitivity (and specificity) of tests for COVID antibodies has been discussed here, and the same logic broadly applies to antigen tests.

Most of the world is missing out on the genomics revolution: why this is bad for science

Yoonsu Cho, Bryony Hayes and Daniel Lawson

As we usher in the era of precision medicine – healthcare tailored to the individual – genetic information is being used to design drugs, tests and medical procedures. While this approach enables physicians to better predict the needs of patients and quickly adopt the most suitable treatment, it should be acknowledged that what is suitable for many, is not suitable for all. Appropriate medical care is linked with ancestry – for example, healthy people with African ancestry naturally exhale less air than reference samples of Europeans, leading to mis-diagnosis for Asthma. For people from Black and Minority Ethnicities, the potential impact of ethnicity is intensely debated in Cancer treatment. Research suggests that lack of BME participation in medical research will lead to poor medication choices, genetic tests being less useful, and any COVID-19 treatments being less well tested.

The World Health Organization has stated that “everyone should have a fair opportunity to attain their full health potential and that no one should be disadvantaged from achieving their potential”. However, systematic discrimination & socio-economic-related disadvantages such as lower education and difficulty accessing high quality jobs are overwhelmingly experienced by non-white people, with statistics showing that 80% of Black African and Caribbean communities are living in England’s most deprived areas (as defined by the Neighbourhood Renewal Fund). These factors contribute to people from those communities receiving worse medical care overall. Beyond this, poor representation in research now can only lead to systematically poorer healthcare in the years to come. In 2009, only 4% of genetic association studies used samples with non-European ancestry. Whilst this rose to almost 20% by 2016, this improvement was largely due to East Asian nations such as Korea, China and Japan initiating their own biobank projects, leaving many ethnicities under-represented. Hence, from a medical genetics perspective, “Black and Minority Ethnicity” (BME) is well defined as “ethnicities without a rich nation to back a representative genetic biobank” and includes African ancestry.

Improving participation of underrepresented populations in Biobanks should make science more useful for all.

Why does biobank representation matter?

Epidemiological comparisons – that is, comparing large numbers of people who develop disease and those that do not – often rely on genetics to infer which behaviours and conditions are causes and which are effects. These analyses use a technique called Mendelian Randomization (MR). MR  has demonstrated, for example, that alcohol consumption causally increases body mass and made it clear that even moderate alcohol intake has no beneficial effect on health outcomes. Causal hypotheses are a critical pathway to drug discovery and public health intervention, but are based almost entirely on European populations. Since there are many genes that affect most disease risk and these are of different importance across ancestries, we cannot be certain that the associations found apply to other populations. This urgently needs to be addressed in order to:

  • promote representative translational research that is relevant to all
  • reduce bias in the consideration of new health policies that may negatively impact minority populations.

Some populations have increased risk from specific diseases, and many people have ancestry from all over the world, making the categorisation of ‘race’ in medicine of some value but increasingly problematic. The IEU leads work on measuring this ancestry variation, which is important for individuals’ health. Getting at the cause of disease is key for understanding the effects of genes on disease risk and traits. Data on varied ethnicities is valuable for science, simply by showing us more variation. Traits such as height, weight and pre-inclination for education may not be directly related to ethnicity, but data from varied ancestries still helps to separate genetic cause from effect. Paradoxically, the least available data on African ancestry is particularly valuable scientifically, due to the lack of variation in the population that came out-of-africa around 50,000 years ago.

Science and the public improving representation together

Acknowledgement of this deficit is becoming more widespread, and the Black Lives Matter movement has refocused attention on representation in science, but the solution remains undetermined. How do we in the science and research community push for better diversity and representation in our resources? Biobanks operate on a consensual ‘opt in, opt out’ system and tend to favour certain groups. In 2016 the Financial Times generalised the participants of UK Biobank and “healthy, wealthy and white”, but why do so many more individuals from this demographic ‘opt in’? In 2018 Prictor et al theorised that BME groups may experience more barriers to participation such as location, cultural sensitivities around human tissue, and issues of literacy and language. However, given the history of the relationship between the research community and minority groups, seen in cases such as the Tuskegee Study, it is easy to see why BME populations might be less inclined to participate, if invited.

Although there is still need for considerable change, several recent developments will help, including the China Kadoori Biobank, the ancestrally diverse US-based Million Veterans program, and many others. However, given restrictions on privacy and reporting methods, these biobanks are hard to compare. Currently the IEU is part of a multi-national effort to develop tools to get the best science possible out of these comparisons, whilst simultaneously respecting privacy and data security issues. The IEU has been collaborating with various research groups across the world to make our research more reproducible. Building tools that work at scale is a challenge encompassing Mathematics, Statistics, Computer Science, Engineering, Genomics and Epidemiology, but this work is paving the way to promoting representative research that is inclusive and applicable for all.


Are schools in the COVID-19 era safe?

Sarah Lewis, Marcus Munafo and George Davey Smith

Follow Sarah, George and Marcus on Twitter

The COVID-19 pandemic caused by the SARS-COV2 virus in 2020 has so far resulted in a heavy death toll and caused unprecedented disruption worldwide. Many countries have opted for drastic measures and even full lockdowns of all but essential services to slow the spread of disease and to stop health care systems becoming overwhelmed. However, whilst lockdowns happened fast and were well adhered to in most countries, coming out of lockdown is proving to be more challenging. Policymakers have been trying to balance relaxing restriction measures with keeping virus transmission low. One of the most controversial aspects has been when and how to reopen schools.

Many parents and teachers are asking: Are schools safe?

The answer to this question depends on how much risk an individual is prepared to accept – schools have never been completely “safe”. Also, in the context of this particular pandemic, the risk from COVID-19 to an individual varies substantially by age, sex and underlying health status. However, from a historical context, the risk of death from contracting an infectious disease in UK schools (even in the era of COVD-19) is very low compared to just 40 years ago, when measles, mumps, rubella and whooping cough were endemic in schools. Similarly, from a global perspective UK schools are very safe – in Malawi, for example, the mortality rate for teachers is around five times higher than in the UK, with tuberculosis causing more than 25% of deaths among teachers.

In this blog post we use data on death rates to discuss safety, because there is currently better evidence on death rates by occupational status than, for example, infection rates. This is because death rates related to COVID-19 have been consistently reported by teh Office for National Statistics, whereas data on infection rates depends very much on the level of testing in the community (which has changed over time and differs by region).

Risks to children

Thankfully the risk of serious disease and death to children throughout the pandemic, across the UK and globally, has been low. Children (under 18 years) make up around 20% of the UK population, but account for only around 1.5% of those hospitalised with COVID-19. This age group have had better outcomes according to all measures compared to adults. As of the 12th June 2020, there have been 6 deaths in those with COVID-19 among those aged under 15 years across England and Wales. Whilst extremely sad, these deaths represent a risk of around 1 death per 2 million children. To place this in some kind of context, the number of deaths expected due to lower respiratory tract infections among this age group in England and Wales over a 3 month period is around 50 and 12 children would normally die due to road traffic accidents in Great Britain over a 3-month period.

Risks to teachers

Our previous blog post concluded that based on available evidence the risk to teachers and childcare workers within the UK from Covid-19 did not appear to be any greater than for any other group of working age individuals. It considered mortality from COVID-19 among teachers and other educational professionals who were exposed to the virus prior to the lockdown period (23rd March 2020) and had died by the 20th April 2020 in the UK. This represents the period when infection rates were highest, and when children were attending school in large numbers. There were 2,494 deaths among working-age individuals up to this date, and we found that the 47 deaths among teachers over this period represented a similar risk to all professional occupations – 6.7 (95% CI 4.1 to 10.3) per 100,000 among males and 3.3 (95% CI 2.0 to 4.9) per 100,000 among females.

The Office for National Statistics (ONS) has since updated the information on deaths according to occupation to include all deaths up to the 25th May 2020. The new dataset includes a further 2,267 deaths among individuals with COVID-19. As the number of deaths had almost doubled during this extended period, so too had the risk. A further 43 deaths had occurred among teaching and education professionals, bringing the total number of deaths involving COVID-19 among this occupational group to 90. It therefore appears that lockdown (during which time many teachers have not been in school) has not had an impact on the rate at which teachers have been dying from COVID-19.

As before, COVID-19 risk does not appear greater for teachers than other working age individuals

The revised risk to teachers of dying from COVID-19 remains very similar to the overall risk for all professionals at 12.9 (95% CI 9.3 to 17.4) per 100,000 among all male teaching and educational professionals and 6.0 (95% CI 4.2 to 8.1) per 100,000 among all females, compared with 11.6 (95%CI 10.2 to 13.0) per 100,000 and 8.0 (95%CI 6.8 to 9.3) per 100,000 among all male and female professionals respectively. It is useful to look at the rate at which we would normally expect teaching and educational professionals to die during this period, as this tells us by how much COVID-19 has increased mortality in this group. The ONS provide this in the form of average mortality rates for each occupational group for same 11 week period over the last 5 years.  The mortality due to COVID-19 during this period represents 33% for males and 19% for females of their average mortality over the last 5 years for the same period. For male teaching and educational professionals, the proportion of average mortality due to COVID-19 is very close to the value for all working-aged males (31%) and all male professionals (34%). For females the proportion of average mortality due to COVID-19 is lower than for all working-aged females (25%) and for female professionals (25%). During the pandemic period covered by the ONS, there was little evidence that deaths from all causes among the group of teaching and educational professionals were elevated above the 5-year average for this group.

Teaching is a comparatively safe profession

It is important to note that according to ONS data on adults of working age (20-59 years) between 2001-2011, teachers and other educational professionals have low overall mortality rates compared with other occupations (ranking 3rd  safest occupation for women and 6th for men). The same study found a 3-fold difference between annual mortality among teachers and among the occupational groups with the highest mortality rates (plant and machine operatives for women and elementary construction occupations among men). These disparities in mortality from all causes also exist in the ONS data covering the COVID-19 pandemic period, but were even more pronounced with a 7-fold difference between males teaching and educational professionals and male elementary construction occupations, and a 16-fold difference between female teachers and female plant and machine operatives.

There is therefore currently no indication that teachers have an elevated risk of dying from COVID-19 relative to other occupations, and despite some teachers having died with COVID19, the mortality rate from all causes (including COVID19) for this occupational group over this pandemic period is not substantially higher than the 5 year average.

Will reopening schools increase risks to teachers?

One could argue that the risk to children and teachers has been low because schools were closed for much of the pandemic, and children have largely been confined to mixing with their own households, so that when schools open fully risk will increase. However, infection rates in the community are now much lower than they were at their peak, when schools were fully open to all pupils without social distancing. Studies which have used contract tracing to determine whether infected children have transmitted the disease to others have consistently shown that they have not, although the number of cases included has been small, and asymptomatic children are often not tested. Modelling studies estimate that even if schools fully reopen without social distancing, this is likely to have only modest effects on virus transmission in the community. If infection levels can be controlled – for example by testing and contact tracing efforts – and cases can be quickly isolated, then we believe that schools pose a minimal risk in terms of the transmission of COVID, and to the health of teachers and children. Furthermore, the risk is likely to be more than offset by the harms caused by ongoing disruption to children’s educational opportunities.

Sarah Lewis is a Senior Lecturer in Genetic Epidemiology in the department of Population Health Sciences, and is an affiliated member of the MRC Integrative Epidemiology Unit (IEU), University of Bristol.

Marcus Munafo is a Professor of Biological Psychology, in the School of Psychology Science and leads the Causes, Consequences and Modification of Health Behaviours programme of research in the IEU, University of Bristol.

George Davey Smith is a Professor of Clinical Epidemiology, and director of the MRC IEU, University of Bristol.

Maximum cigarette pack size: a neglected aspect of tobacco control

Written by Anna Blackwell, Senior Research Associate

Follow Bristol Tobacco and Alcohol Research Group (TARG) on twitter

The manufacturing or importing of packs of cigarettes with fewer than 20 cigarettes per pack was prohibited in the UK when the EU Tobacco Products Directive and standardised packaging legislation were fully implemented in May 2017. This change was aimed at reducing the affordability of cigarettes and thereby discouraging young people from smoking. This directive also required the removal of branding and established a standard shape and dark green colour for packaging, including pictorial health warnings, which prevented the use of packaging for promotion and reduced its appeal.

However, the tobacco industry has been able to exploit loopholes in recent packaging regulations, including the absence of a regulated maximum pack size, by introducing non-standard and larger pack sizes to the market to distinguish products. This is a public health concern given evidence that larger pack sizes are linked to increased smoking, and could undermine existing tobacco control success.

Evidence shows that larger pack sizes are linked to increased smoking.

In a recent Addiction Opinion and Debate paper, we proposed that a cap on cigarette pack size should be introduced; a pragmatic solution would be to permit only a single pack size of 20, which is now the minimum in many countries. This approach would reduce the number of cigarettes in packs in several countries such as Australia – where packs up to sizes of 50 are available – and prevent larger sizes being introduced elsewhere.

Capping cigarette pack size therefore has the potential to both reduce smoking and prevent increased smoking. While the health benefits of reducing smoking alone are small, it may have important indirect effects on health through its role in facilitating quitting. Those smoking fewer cigarettes per day are more likely to attempt to quit and succeed in doing so. Trials of smoking-reduction interventions have also found that these can lead to increased quitting when combined with nicotine replacement therapy.

Our Opinion and Debate paper drew on evidence from a range of sources including industry documents and analyses, population surveys, intervention trials and Mendelian randomization analyses. Together these suggest that consumption increases with larger pack size, and cessation increases with reduced consumption. However, direct experimental evidence is not currently available to determine whether pack size influences the amount of tobacco consumed, or whether the association is due to other factors.

People who want to quit may be using smaller packs as a method of self-control, and smokers who successfully cut down and later quit may be more motivated to do so. Cost is also an important factor and larger packs may be linked to increased smoking because they have a lower cost per cigarette. Further research is needed to determine whether the associations between pack size, smoking and cessation are causal to estimate the impact of policies to cap cigarette pack size.

Commentaries on our Opinion and Debate paper, published in the May 2020 Issue of Addiction highlight the need to understand the mechanisms for the associations observed between pack size and smoking in order to identify the optimal cigarette pack size. Although mandating packs of 20 is a pragmatic approach, pack size regulation needs to achieve a compromise between tobacco affordability and smokers’ self-regulation. Nevertheless, the policy debate should start now to address this neglected aspect of tobacco control.

To find out more visit the Behaviour Change by Design website or follow us on Twitter @BehavChangeDsgn @BristolTARG


This blog post is reposted from the TARG blog.

We should be cautious about associations of patient characteristics with COVID-19 outcomes that are identified in hospitalised patients.

Gareth J Griffith, Gibran Hemani, Annie Herbert, Giulia Mancano, Tim Morris, Lindsey Pike, Gemma C Sharp, Matt Tudball, Kate Tilling and Jonathan A C Sterne, together with the authors of a preprint on collider bias in COVID-19 studies.

All authors are members of the MRC Integrative Epidemiology Unit at the University of Bristol. Jonathan Sterne is Director of Health Data Research UK South West

Among successful actors, being physically attractive is inversely related to being a good actor. Among American college students, being academically gifted is inversely related to being good at sport.

Among people who have had a heart attack, smokers have better subsequent health than non-smokers. And among low birthweight infants, those whose mothers smoked during pregnancy are less likely to die than those whose mothers did not smoke.

These relationships are not likely to reflect cause and effect in the general population: smoking during pregnancy does not improve the health of low birthweight infants. Instead, they arise from a phenomenon called ‘selection bias’, or ‘collider bias’.

Understanding selection bias

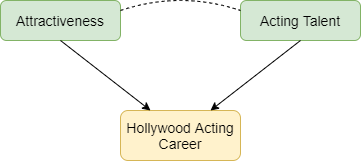
Selection bias occurs when two characteristics influence whether a person is included in a group for which we analyse data. Suppose that two characteristics (for example, physical attractiveness and acting talent) are unrelated in the population but that each causes selection into the group (for example, people who have a successful Hollywood acting career). Among individuals with a successful acting career we will usually find that physical attractiveness will be negatively associated with acting talent: individuals who are more physically attractive will be less talented actors (Figure 1). Selection bias arises if we try to infer a cause-effect relationship between these two characteristics in the selected group. The term ‘collider bias’ refers to the two arrows indicating cause and effect that ‘collide’ at the effect (being a successful actor).

Figure 1: Selection effects exerted on successful Hollywood actors. Green boxes highlight characteristics that influence selection. Yellow boxes indicate the variable selected upon. Arrows indicate causal relationships: the dotted line indicates a non-causal induced relationship that arises because of selection bias.

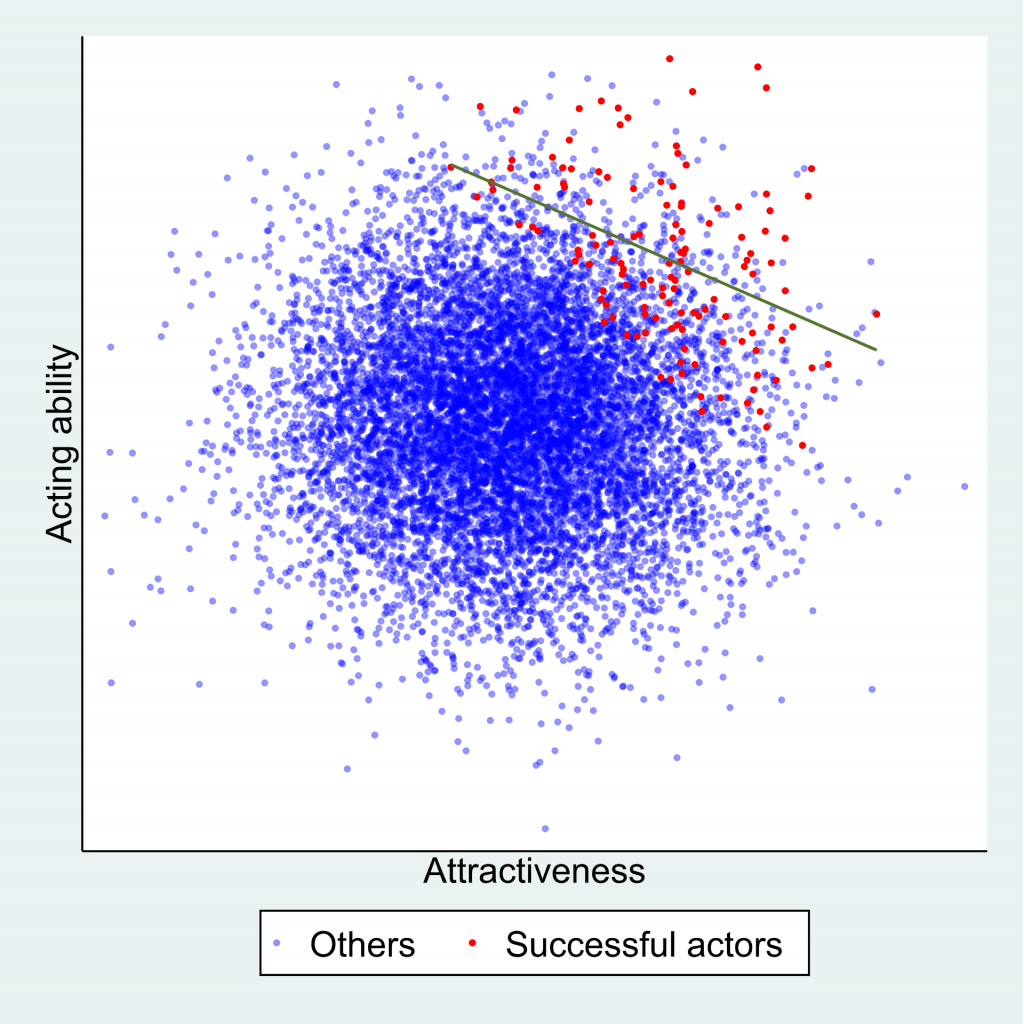
Figure 2 below explains this phenomenon. Each point represents a hypothetical person, with their level of physical attractiveness plotted against their level of acting talent. In the general population (all data points) an individual’s attractiveness tells us nothing about their acting ability – the two characteristics are unrelated. The red data points represent successful Hollywood actors, who tend to be more physically attractive and to be more talented actors. The blue data points represent other people in the population. Among successful actors the two characteristics are strongly negatively associated (green line), solely because of the selection process. The direction of the bias (whether it is towards a positive or negative association) depends on the direction of the selection processes. If they act in the same direction (both positive or both negative) the bias will usually be towards a negative association. If they act in opposite directions the bias will usually be towards a positive association.

Figure 2:  The effect of sample selection on the relationship between attractiveness and acting talent. The green line depicts the negative association seen in successful actors.


Why is selection bias important for COVID-19 research?

In health research, selection processes may be less well understood, and we are often unable to observe the unselected group. For example, many studies of COVID-19 have been restricted to hospitalised patients, because it was not possible to identify all symptomatic patients, and testing was not widely available in the early phase of the pandemic. Selection bias can seriously distort relationships of risk factors for hospitalisation with COVID-19 outcomes such as requiring invasive ventilation, or mortality.

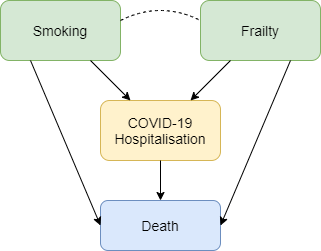
Figure 3 shows how selection bias can distort risk factor associations in hospitalised patients. We want to know the causal effect of smoking on risk of death due to COVID-19, and the data available to us is on patients hospitalised with COVID-19. Associations between all pairs of factors that influence hospitalisation will be distorted in hospitalised patients. For example, if smoking and frailty each make an individual more likely to be hospitalised with COVID-19 (either because they influence infection with SARS-CoV-2 or because they influence COVID-19 disease severity), then their association in hospitalised patients will usually be more negative than in the whole population. Unless we control for all causes of hospitalisation, our estimate of the effect of any individual risk factor on COVID-19 mortality will be biased. For example, it would be unsurprising that within hospitalised patients with COVID-19 we observe that smokers have better health than non-smokers because they are likely to be younger and less frail, and therefore less likely to die after hospitalisation. But that finding may not reflect a protective effect of smoking on COVID-19 mortality in the whole population.

Figure 3: Selection effects on hospitalisation with COVID-19. Box colours are as in Figure 1. Blue boxes represent outcomes. Arrows indicate causal relationships, the dotted line indicates a non-causal induced relationship that arises because of selection bias.


Selection bias may also be a problem in studies based on data from participants who volunteer to download and use COVID-19 symptom reporting apps. People with COVID-19 symptoms are more likely to use the app, and so are people with other characteristics (younger people, people who own a smartphone, and those to whom the app is promoted on social media). Risk factor associations within app users may therefore not generalise to the wider population.

What can be done?

Findings from COVID-19 studies conducted in selected groups should be interpreted with great caution unless selection bias has been explicitly addressed. Two ways to do so are readily available. The preferred approach uses representative data collection for the whole population to weight the sample and adjust for the selection bias.  In absence of data on the whole population, researchers should conduct sensitivity analyses that adjust their findings based on a range of assumptions about the selection effects. A series of resources providing further reading, and tools allowing researchers to investigate plausible selection effects are provided below.

For further information please contact Gareth Griffith (g.griffith@bristol.ac.uk) or Jonathan Sterne (jonathan.sterne@bristol.ac.uk).

Further reading and selection tools:

Dahabreh IJ and Kent DM. Index Event Bias as an Explanation for the Paradoxes of Recurrence Risk Research. JAMA 2011; 305(8): 822-823.

Griffith, Gareth, Tim M. Morris, Matt Tudball, Annie Herbert, Giulia Mancano, Lindsey Pike, Gemma C. Sharp, Jonathan Sterne, Tom M. Palmer, George Davey Smith, Kate Tilling, Luisa Zuccolo, Neil M. Davies, and Gibran Hemani. Collider Bias undermines our understanding of COVID-19 disease risk and severity. Interactive App 2020 http://apps.mrcieu.ac.uk/ascrtain/

Groenwold, RH, Palmer TM and Tilling K. Conditioning on a mediator to adjust for unmeasured confounding OSF Preprint 2020: https://osf.io/vrcuf/

Hernán MA, Hernández-Díaz S and Robins JM. A structural approach to selection bias. Epidemiology 2004; 15: 615-625.

Munafo MR, Tilling K, Taylor AE, Evans DM and Davey Smith G. Collider Scope: When Selection Bias Can Substantially Influence Observed Associations. International Journal of Epidemiology 2018; 47: 226-35.

Luque-Fernandez MA, Schomaker M, Redondo-Sanchez D, Sanchez Perez MJ, Vaidya A and Schnitzer ME. Educational Note: Paradoxical collider effect in the analysis of non-communicable disease epidemiological data: a reproducible illustration and web application International Journal of Epidemiology 2019; 48: 640-653. Interactive App: https://watzilei.com/shiny/collider/

Smith LH and VanderWeele TJ. Bounding bias due to selection. Epidemiology 2019; 30: 509-516. Interactive App: https://selection-bias.herokuapp.com